Figure 1
Abdominal obesity in predicting myocardial infarction risk. Waist-to-Hip Ratio: The metric that confused cardiology worldwide for a long time
Angel Martin Castellanos*
Published: 24 March, 2021 | Volume 6 - Issue 1 | Pages: 026-028
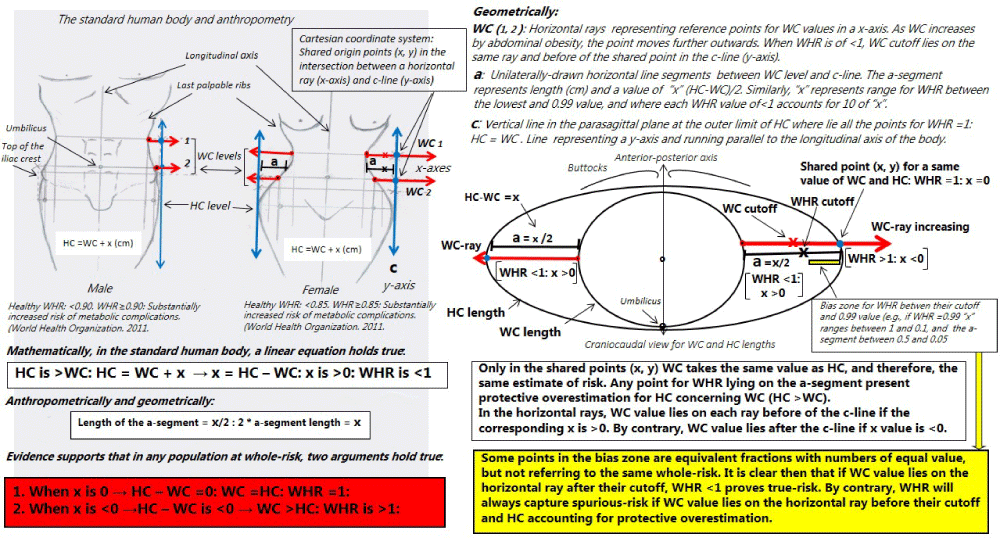
Figure 1:
Original assembly from anthropometric models and geometric lines on the standard human body. Geometrical and mathematical demonstrations for a correct anthropometric assessment of the abdominal obesity and CVD risk. Drawings representing the human body (both sexes) where metrics would be sample mean values per standard deviation for WC, HC and WHR being actually valid for any anthropometrically healthy population and ethnicity. In the respective lines drawn would lie points of increased abdominal obesity representing mean values for thousands of cases of CVD as well as biological changes pointing towards greater excess risk of CVD as WC increases. Similarly, the corresponding cut-off points associated per standard deviation, or quintiles, quartiles/tertiles or Receiver Operating Characteristic analysis for WC and WHR will always lie before of the c-line. The anthropometric models and schemes are valid for both case-control and cohort studies, and any type of cardiovascular event. Explanations for understanding, in text. Names of lines and rays, where appropriate. The origin of the horizontal rays represent the same level of measurement for WC. CVD, cardiovascular disease; HC, hip circumference; WC, waist circumference; WHR waist-to-hip ratio.
Read Full Article HTML DOI: 10.29328/journal.jccm.1001113 Cite this Article Read Full Article PDF
More Images
Similar Articles
-
Left Atrial Remodeling is Associated with Left Ventricular Remodeling in Patients with Reperfused Acute Myocardial InfarctionChristodoulos E. Papadopoulos*,Dimitrios G. Zioutas,Panagiotis Charalambidis,Aristi Boulbou,Konstantinos Triantafyllou,Konstantinos Baltoumas,Haralambos I. Karvounis,Vassilios Vassilikos. Left Atrial Remodeling is Associated with Left Ventricular Remodeling in Patients with Reperfused Acute Myocardial Infarction. . 2016 doi: 10.29328/journal.jccm.1001001; 1: 001-008
-
Mid-Ventricular Ballooning in Atherosclerotic and Non-Atherosclerotic Abnormalities of the Left Anterior Descending Coronary ArteryStefan Peters*. Mid-Ventricular Ballooning in Atherosclerotic and Non-Atherosclerotic Abnormalities of the Left Anterior Descending Coronary Artery. . 2016 doi: 10.29328/journal.jccm.1001002; 1:
-
Concentration Polarization of Ox-LDL and Its Effect on Cell Proliferation and Apoptosis in Human Endothelial CellsShijie Liu*,Jawahar L Mehta,Yubo Fan,Xiaoyan Deng,Zufeng Ding*. Concentration Polarization of Ox-LDL and Its Effect on Cell Proliferation and Apoptosis in Human Endothelial Cells. . 2016 doi: 10.29328/journal.jccm.1001003; 1:
-
Intermittent Left Bundle Branch Block: What is the Mechanism?Hussam Ali*,Riccardo Cappato. Intermittent Left Bundle Branch Block: What is the Mechanism?. . 2017 doi: 10.29328/journal.jccm.1001004; 2:
-
Congenital Quadricuspid Aortic Valve, a Rare Cause of Aortic Insufficiency in Adults: Case ReportCyrus Kocherla*,Kalgi Modi. Congenital Quadricuspid Aortic Valve, a Rare Cause of Aortic Insufficiency in Adults: Case Report. . 2017 doi: 10.29328/journal.jccm.1001005; 2: 003-007
-
Short and Medium-Term Evaluation of Patients in Coronary Post-Angioplasty: Préliminary results at the Cardiology Department of the Hospital University Aristide Le Dantec of Dakar (Senegal): Study on 38 CasesDioum M*,Aw F,Masmoudi K,Gaye ND,Sarr SA,Ndao SCT, Mingou J,Ngaidé AA,Diack B,Bodian M,Ndiaye MB,Diao M,Ba SA. Short and Medium-Term Evaluation of Patients in Coronary Post-Angioplasty: Préliminary results at the Cardiology Department of the Hospital University Aristide Le Dantec of Dakar (Senegal): Study on 38 Cases. . 2017 doi: 10.29328/journal.jccm.1001006; 2: 008-012
-
Indications and Results of Coronarography in Senegalese Diabetic Patients: About 45 CasesNdao SCT*,Gaye ND,Dioum M,Ngaide AA,Mingou JS,Ndiaye MB, Diao M,Ba SA. Indications and Results of Coronarography in Senegalese Diabetic Patients: About 45 Cases. . 2017 doi: 10.29328/journal.jccm.1001007; 2: 013-019
-
Procedure utilization, latency and mortality: Weekend versus Weekday admission for Myocardial InfarctionNader Makki,David M Kline,Arun Kanmanthareddy,Hansie Mathelier,Satya Shreenivas,Scott M Lilly*. Procedure utilization, latency and mortality: Weekend versus Weekday admission for Myocardial Infarction. . 2017 doi: 10.29328/journal.jccm.1001008; 2: 020-025
-
Spontaneous rupture of a giant Coronary Artery Aneurysm after acute Myocardial InfarctionOğuzhan Çelik,Mucahit Yetim,Tolga Doğan,Lütfü Bekar,Macit Kalçık*,Yusuf Karavelioğlu. Spontaneous rupture of a giant Coronary Artery Aneurysm after acute Myocardial Infarction. . 2017 doi: 10.29328/journal.jccm.1001009; 2: 026-028
-
Thrombolysis, the only Optimally Rapid Reperfusion TreatmentVictor Gurewich*. Thrombolysis, the only Optimally Rapid Reperfusion Treatment. . 2017 doi: 10.29328/journal.jccm.1001010; 2: 029-034
Recently Viewed
-
Management of Non-contact Injuries, Nonspecific Chronic Pain, and Prevention via Sensory Conflicts Detection: Vertical Heterophoria as a Landmark IndicatorEric Matheron*. Management of Non-contact Injuries, Nonspecific Chronic Pain, and Prevention via Sensory Conflicts Detection: Vertical Heterophoria as a Landmark Indicator. J Nov Physiother Rehabil. 2024: doi: 10.29328/journal.jnpr.1001057; 8: 005-013
-
A General Evaluation of the Cellular Role in Drug Release: A Clinical Review StudyMohammad Hossein Karami* and Majid Abdouss*. A General Evaluation of the Cellular Role in Drug Release: A Clinical Review Study. Clin J Obstet Gynecol. 2024: doi: 10.29328/journal.cjog.1001162; 7: 042-050
-
Factors Influencing Knowledge on the Completion of Treatment among Tuberculosis Patients under Directly Observed Treatment Strategy (DOTS) in a Selected Health Facility, the BahamasEsther S Daniel*, Latasha Collie, Alice Neymour, Nicole KA Martin-Chen, Kevin Moss, Kathy-Ann Lootawan, Virginia M Victor. Factors Influencing Knowledge on the Completion of Treatment among Tuberculosis Patients under Directly Observed Treatment Strategy (DOTS) in a Selected Health Facility, the Bahamas. Clin J Nurs Care Pract. 2024: doi: 10.29328/journal.cjncp.1001053; 8: 022-030
-
Significance and Prospect of Brf1 OverexpressionLiling Zheng*, Yongluan Lin, Zaifa Hong, Dongyan Shen, Shuping Zhong*. Significance and Prospect of Brf1 Overexpression. Arch Pharm Pharma Sci. 2023: doi: 10.29328/journal.apps.1001043; 7:
-
Hypersexual Disorder: A Comprehensive Review of Conceptualization, Etiology, Assessment and TreatmentShashank Tiwari*. Hypersexual Disorder: A Comprehensive Review of Conceptualization, Etiology, Assessment and Treatment. Arch Pharm Pharma Sci. 2023: doi: 10.29328/journal.apps.1001044; 7: 054-063
Most Viewed
-
Evaluation of Biostimulants Based on Recovered Protein Hydrolysates from Animal By-products as Plant Growth EnhancersH Pérez-Aguilar*, M Lacruz-Asaro, F Arán-Ais. Evaluation of Biostimulants Based on Recovered Protein Hydrolysates from Animal By-products as Plant Growth Enhancers. J Plant Sci Phytopathol. 2023 doi: 10.29328/journal.jpsp.1001104; 7: 042-047
-
Feasibility study of magnetic sensing for detecting single-neuron action potentialsDenis Tonini,Kai Wu,Renata Saha,Jian-Ping Wang*. Feasibility study of magnetic sensing for detecting single-neuron action potentials. Ann Biomed Sci Eng. 2022 doi: 10.29328/journal.abse.1001018; 6: 019-029
-
Physical activity can change the physiological and psychological circumstances during COVID-19 pandemic: A narrative reviewKhashayar Maroufi*. Physical activity can change the physiological and psychological circumstances during COVID-19 pandemic: A narrative review. J Sports Med Ther. 2021 doi: 10.29328/journal.jsmt.1001051; 6: 001-007
-
Pediatric Dysgerminoma: Unveiling a Rare Ovarian TumorFaten Limaiem*, Khalil Saffar, Ahmed Halouani. Pediatric Dysgerminoma: Unveiling a Rare Ovarian Tumor. Arch Case Rep. 2024 doi: 10.29328/journal.acr.1001087; 8: 010-013
-
Prospective Coronavirus Liver Effects: Available KnowledgeAvishek Mandal*. Prospective Coronavirus Liver Effects: Available Knowledge. Ann Clin Gastroenterol Hepatol. 2023 doi: 10.29328/journal.acgh.1001039; 7: 001-010

HSPI: We're glad you're here. Please click "create a new Query" if you are a new visitor to our website and need further information from us.
If you are already a member of our network and need to keep track of any developments regarding a question you have already submitted, click "take me to my Query."


