
More Information
Submitted: 13 September 2019 | Approved: 03 October 2019 | Published: 04 October 2019
How to cite this article: Aboul-Enein HM, El Naggar AE, Farag SI, Hassan WAA. Plaque morphology in diabetic vs. non diabetic patients assessed by Multi-Slice Computed Tomography coronary angiography. J Cardiol Cardiovasc Med. 2019; 4: 150-155.
DOI: 10.29328/journal.jccm.1001057
ORCID ID: 0000-0002-7835-8489
Copyright License: © 2019 Aboul-Enein HM, et al. This is an open access article distributed under the Creative Commons Attribution License, which permits unrestricted use, distribution, and reproduction in any medium, provided the original work is properly cited.
Keywords: Computed tomography; DM; Coronary artery; Atherosclerosis

Plaque morphology in diabetic vs. non diabetic patients assessed by Multi-Slice Computed Tomography coronary angiography
Hesham Mohamed Aboul-Enein, Amr Elsayed El Naggar, Shereen Ibrahim Farag and Waleed Atef Ahmed Hassan*
Cardiology Department, Faculty of Medicine, Banha University, Egypt
*Address for Correspondence: Waleed Atef Ahmed Hassan, Cardiology Department, Faculty of Medicine, Banha University, Egypt, Tel: 01061294690; Email: [email protected]
Background and Objectives: Multi-slice computed tomography (MSCT) provides high accuracy for noninvasive assessment of coronary artery disease (CAD). The introduction of the latest computed tomography technology allows comprehensive evaluation of various aspects of CAD, including the coronary calcium score, coronary artery stenosis, bypass patency, and myocardial function. This study aimed to assess the effect of DM on coronary arteries evaluated by MSCT-CA Comparing Plaque Morphology in Diabetic patients with Non-Diabetic Whoever Controlled or not assessed by HbA1c.
Methods: In this study we randomly assigned 150 adult patients were diagnosed with suspected coronary artery disease underwent MSCT-CA for evaluation their coronaries regarding luminal stenosis, Plaque analysis, Remodeling index, SSS, SIS and Ca score.
Results: There was statistically significant difference between diabetics & non-diabetic groups in LM lesions with (P = 0.029). also, the results of multivariate logistic regression analysis after adjustment for age and sex, diabetics were shown a trend toward more mixed plaque with statistically significant {(OR): 3.422, 95% CI 1.66-7.023, P = 0.001}; whereas, after adjustment for age, sex, history of hypertension, smoking, and hypercholesterolemia, patients with diabetes also shown a trend toward more mixed plaque with statistically significant (OR: 3.456, 95% CI 1.668-7.160, P = 0.001). It means significant differences in coronary atherosclerotic plaque burden and composition between diabetic and non-diabetic patients, with a higher proportion of mixed plaques, a more vulnerable form of atherosclerotic plaque in diabetics (P < 0.001) otherwise No significant difference.
Conclusion: MSCT angiography may be useful for the identification of CAD in diabetic and non-diabetic patients. There were statistically significant differences in coronary atherosclerotic plaque burden and composition, with a higher proportion of mixed plaques, between diabetic and nondiabetic patients. Furthermore, MSCT may give accurate information about plaque characteristics according to different coronary risk factors, thereby identifying high risk features warranting a more intensive anti-atherosclerotic treatment.
Diabetes mellitus is related to the distribution and severity of coronary artery disease (CAD). Patients with diabetes have a significant risk for atherosclerotic vascular disease, and aggressive management of risk factors is recommended in these patients. Therefore, the role of coronary imaging in diabetic patients is not only to prove the presence of coronary narrowing but to detect those patients with a higher risk in whom further testing may be warranted in order to identify those with significant inducible myocardial ischemia [1]. High HbA1c was related to 2 feature plaque (FP), obstructive disease and Extensive Disease. It was reported close association of (HbA1c) and the extent and presence of Atherosclerosis plaques [2].
Multi-detector row computed coronary tomography (MDCT) has proven to be useful Non-invasive tool not only for similar accurately detecting obstructive atherosclerotic processes compared to conventional arteriography [3]. The severity of luminal diameter stenosis was scored as non (0% luminal stenosis), non-obstructive (plaques with a lumen narrowing < 50%), or obstructive (plaques with maximum stenosis ≥ 50%) [4]. High risk plaque was defined as two feature positive plaque which consists of Positive remodeling (remodeling index >1.1) and low Attenuation (<30 HU) [5].
One hundred and fifty (150) patients with suspected coronary artery disease were prospectively recruited from Kobry -Elkobba (OPC) of cardiology underwent CCTA “Dual-source CT (Siemens Healthcare SOMATOM Definition Flash)” scan and they were classified into two Groups: Group (1): 75 Diabetic Patient & Group (2): 75 Non-Diabetic Patients. Patients with suspected symptoms of CAD (chest pain, ECG changes, dyspnea on exertion, multiple risk factors) were eligible for inclusion. Exclusion criteria included patient known to be ischemic, prior CABG or PCI, creatinine >1.5 mg/dl, contrast allergy, Contraindication for CT, or any types of arrhythmia. Informed consents were obtained from all participants. The study approved by the ethics committee on research involving human subjects of Faculty of Medicine-Banha University Medical Since. Demographic variables and CAD risk factors are presented in table 1.
All study population experienced the accompanying indicative work up:
1. Full medical history including (Age, sex, BMI, symptoms suggestive of cardiac disease and current medications.
2. Twelve lead electrocardiogram (ECG) to exclude established AF and to measure PR interval and p-wave morphology to exclude heart block of any degree or nodal rhythm.
3. Past history relevant to CAD.
4. Risk factors Smoking, hypertension, Dyslipidemia, Positive family history.
5. Laboratory investigations were done for all patients (serum creatinine, HbA1C & lipid profile).
6. Coronary CT Angiography.
Scan protocol
CCTA was performed with a dual-source CT (DSCT) (Siemens) scan. Heart rates of all patients were determined 1 h before examinations. If heart rate was ≥ 65 bpm, the patient was orally administered 40-80 mg of oral beta blocker propranolol hydrochloride (Inderal at 40 mg/tablet) except those with contraindications to beta-blockers. A 0.5 mg sublingual dose of nitroglycerin was administered just before the scan. In each patient 60 ml of iodinated contrast mixed with 60 ml of saline solution was injected. Contrast was given in Two phases; first phase administration of contrast was controlled by test bolus in the ascending aorta. The scan delay was 12 s. Second phase was administration of main contrast material then images were reconstructed immediately after completing the scan to identify motion free coronary artery images. The reconstructed CT image data were transferred to a computer workstation for post-processing, including axial, multi-planar reformat, maximum intensity projection, and short-axis, cross-sectional views. In all individuals, irrespective of the image quality, every arterial segment was scored in an intent-to-diagnose fashion [6].
MSCT analysis
Athero-scleromatous plaque was defined as any clearly discernable structure Larger Than 1-2 mm which was assigned to the coronary artery wall in two perpendiculars image planes. Remodeling index was obtained by dividing the vessel diameter at the plaque site by the diameter at the reference site. Positive remodeling was reported when the remodeling index is larger than 1.1. The plaque was referred to as low attenuation plaque [7]. Two feature positive (FP) plaques were defined as plaque with positive remodeling and low attenuation [5]. The severity of luminal diameter stenosis was scored as none (0% luminal stenosis), non-obstructive (plaques with a lumen narrowing ˂ 50%), or obstructive (plaques with maximum stenosis ≥ 50%). Diagnosis of CAD was made based on the maximum intra-luminal stenosis in any of the segments of the major epicardial coronary arteries at the ≥ 50% stenosis threshold. Obstructive CAD in the diagonal branches, obtuse marginal branches, and postero-lateral branches was considered to be part of the left anterior descending (LAD) artery, left circumflex (LCX) artery, and right coronary artery (RCA) system, respectively. Depending on the coronary artery dominance, the posterior descending artery was considered to be part of the RCA or LCX system [6]. Segment involvement score (SIS) was calculated as a measure of overall Coronary artery plaque distribution [4]. Coronary artery calcium was identified as a dense area in the coronary artery exceeding the threshold of 130 HU. An overall Agatston score was recorded for each patient [8].
Statistical analysis
Data gathered throughout history, basic clinical examination, laboratory investigations and outcome measures coded, entered and analyzed using Microsoft Excel software. Data were then transported in into Statistical Package for the Social Sciences (SPSS version 25) (Statistical Package for the Social Sciences) software for analysis. Data was summarized using mean, standard deviation, median, minimum and maximum in quantitative data and using frequency (count) and relative frequency (percentage) for categorical data. Comparisons between quantitative variables were done using the non-parametric Mann-Whitney test. For comparing categorical data, Chi square (χ2) test was performed. Exact test was used instead when the expected frequency is less than 5. Correlations between quantitative variables were done using Spearman correlation coefficient. Multivariate logistic regression was done with plaque types as dependent variable and DM as independent predictor to adjust for possible confounders. All P values were two sided. P value less than 0.05 were considered as statistically significant.
The study included 150 patients who were diagnosed with suspected CAD, they were classified into two groups: Group (1): 75 Diabetic Patients Group (2): 75 Non-Diabetic Patients. From all 150 patients, about 139 case complete the CT scanning test (70 diabetic patients & 69 non-diabetic patients) and only 11 patients (5 diabetics vs 6 non-diabetics) didn’t complete the test because of High calcium in their coronaries.
Demographic variables and CAD risk factors are presented in table 1
The mean Age in group (1) was (59.47 +/- 8.6 years) and in group (2) (57.7 +/- 7.7 years) with No statistically significant difference between two groups with (P = 0.415). The Study included 143 males (73 in group (1) “97.3%” and 70 in group (2) “93.3%”) and 7 females (2 in group (1) “2.7%” and 5 in group (2) “6.7%”) with NON statistically significant difference (P = 0.442). Risk factors for CAD among the studied patients included Hypertension in 73 patients (42 in group (1) “56.0%” and 31 in group (2) “41.3%”) with No statistically significant difference between two groups with (P = 0.072). Smoking: 68 patients were smoker (25 in group (1) “46.7%” and 33 in group (2) “44.0%”) with No statistically significant difference between two groups with (P = 0.743). Obesity: Body mass index mean in group (1) (26.1 +/- 2.7) and Body mass index in group (2) (26.2 +/- 2.80) with No statistically significant difference between two groups with (P = 0.849).
| Table 1: CAD risk factors and Demographic variables. | ||||||
| Group (1) | Group (2) | P value | ||||
| Count | % | Count | % | |||
| Stenosis LM | No | 65 | 92.9% | 66 | 95.7% | 0.029 |
| Mild | 4 | 5.7% | 0 | 0.0% | ||
| moderate | 0 | 0.0% | 3 | 4.3% | ||
| severe | 1 | 1.4% | 0 | 0.0% | ||
| Stenosis LAD | No | 37 | 52.9% | 33 | 47.8% | 0.567 |
| Mild | 7 | 10.0% | 5 | 7.2% | ||
| moderate | 6 | 8.6% | 11 | 15.9% | ||
| severe | 20 | 28.6% | 20 | 29.0% | ||
| Stenosis LCX | No | 46 | 65.7% | 55 | 79.7% | 0.229 |
| Mild | 4 | 5.7% | 1 | 1.4% | ||
| moderate | 3 | 4.3% | 3 | 4.3% | ||
| severe | 17 | 24.3% | 10 | 14.5% | ||
| Stenosis RCA | No | 48 | 68.6% | 54 | 78.3% | 0.337 |
| Mild | 2 | 2.9% | 3 | 4.3% | ||
| moderate | 8 | 11.4% | 3 | 4.3% | ||
| severe | 12 | 17.1% | 9 | 13.0% | ||
| LM: Left Main Artery; LAD: Left Anterior Descending Artery; LCX: Left Circumflex Artery; RCA: Right Coronary Artery | ||||||
Diagnostic performance of multi-slice computed tomography angiography
Number of coronaries diseased by MSCT: 51 Patients (22 patients were in group (1) “43.1%” and 29 patients were in group (2) “56.9%”) had No Significant Lesions. 47 patients (25 patients were in group (1) “53.2%” and 22 were in group (2) “46.8”) had Single vessel disease. 20 patients (12 patients were in group (1) “60%” and 8 patients were group (2) “40%”) had two vessel disease. 18 patients (9 patients were in group (1) “50%” and 9 patients were in group (2) “50%”) had three vessel disease. 3 patients (two patients were in group (1) “66.7%” and one patient was in group (2) “33.3%”) had Four vessel disease which means affection of LM beside the main three vessels. This study also revealed that the patients with No-significant lesions are more to be in group (2) and CAD are more with group (1) (except with three vessel disease are equally affected), but with statistically No significant difference in both groups (P = 0.698) (Table 2).
| Table 2: Number of coronaries diseased by MSCT. | ||||||
| Group (1) | Group (2) | P value | ||||
| Count | % | Count | % | |||
| Number of Coronaries | 0 | 22 | 31.4% | 29 | 42.0% | 0.698 |
| 1 | 25 | 35.7% | 22 | 31.9% | ||
| 2 | 12 | 17.1% | 8 | 11.6% | ||
| 3 | 9 | 12.9% | 9 | 13.0% | ||
| 4 | 2 | 2.9% | 1 | 1.4% | ||
Degree of LM stenosis: Mild LM stenosis was presented in 4 patients in group (1) (5.7%) vs 0 patient in group (2) (0.0%). Moderate LM stenosis was presented in 0 patient in group (1) (0.0%) vs 3 patients in group (2) (4.3%). Severe LM stenosis was presented in 1 patient in in group (1) (1.4%) vs 0 patient in group (2) (0.0%). There was statistically significant difference between group (1) and group (2) with P = 0.029.
Degree of LAD stenosis: Mild LAD stenosis was presented in 7 patients in group (1) (10.0%) vs 5 patients in group (2) (7.2%). Moderate LAD stenosis was presented in 6 patients in group (1) (8.6%) vs 11 patients in group (2) (15.9%). Severe LAD stenosis was presented in 20 patients in group (1) (28.6%) vs 20 patient in group (2) (29.0%). There was No statistically significant difference between group (1) & group (2) with P = 0.567.
Degree of LCX stenosis: Mild LCX stenosis was presented in 4 patients in group (1) (5.7%) vs 1 patient in group (2) (1.4%). Moderate LCX stenosis was presented in 3 patients in group (1) (4.3%) vs 3 patients in group (2) (4.3%). Severe LCX stenosis was presented in 17 patients in group (1) (24.3%) vs 10 patients in group (2) (14.5%). There was No statistically significant difference between group (1) & group (2) with P = 0.567.
Degree of RCA stenosis: Mild RCA stenosis was presented in 2 patients in group (1) (2.9%) vs 3 patients in group (2) (4.3%). Moderate RCA stenosis was presented in 8 patients in group (1) (11.4%) vs 3 patients in group (2) (4.3%). Severe RCA stenosis was presented in 12 patients in group (1) (17.1%) vs 9 patients in group (2) (13.0%). There was No statistically significant difference between group (1) & group (2) with P = 0.337 (Table 3).
| Table 3: Degree of Coronaries stenosis. | ||||||
| Group (1) | Group (2) | P value | ||||
| Count | % | Count | % | |||
| Stenosis LM | No | 65 | 92.9% | 66 | 95.7% | 0.029 |
| Mild | 4 | 5.7% | 0 | 0.0% | ||
| moderate | 0 | 0.0% | 3 | 4.3% | ||
| severe | 1 | 1.4% | 0 | 0.0% | ||
| Stenosis LAD | No | 37 | 52.9% | 33 | 47.8% | 0.567 |
| Mild | 7 | 10.0% | 5 | 7.2% | ||
| moderate | 6 | 8.6% | 11 | 15.9% | ||
| severe | 20 | 28.6% | 20 | 29.0% | ||
| Stenosis LCX | No | 46 | 65.7% | 55 | 79.7% | 0.229 |
| Mild | 4 | 5.7% | 1 | 1.4% | ||
| moderate | 3 | 4.3% | 3 | 4.3% | ||
| severe | 17 | 24.3% | 10 | 14.5% | ||
| Stenosis RCA | No | 48 | 68.6% | 54 | 78.3% | 0.337 |
| Mild | 2 | 2.9% | 3 | 4.3% | ||
| moderate | 8 | 11.4% | 3 | 4.3% | ||
| severe | 12 | 17.1% | 9 | 13.0% | ||
| LM: Left Main Artery; LAD: Left Anterior Descending Artery; LCX: Left Circumflex Artery; RCA: Right Coronary Artery | ||||||
No Ca score in group (1) were in 24 patients (32.0%) vs 33 patients (44.0%) in group (2). Minimal Ca score (1-10) in group (1) were in 7 patients (9.3%) vs 3 patients (4.0%) in group (2). Mild Ca score (11-100) in group (1) were in 28 patients (37.3%) vs 16 patients (21.3%) in group (2). Moderate Ca score (100-400) in group (1) were in 12 patients (16.0%) vs 16 patients (21.3%) in group (2). Severe Ca score (>400) in group (1) were in 4 patients (5.3%) vs 7 patients (9.3%) in group (2). With No statistically significant difference between the two groups (P = 0.104) (Table 4).
| Table 4: Ca score in Coronaries. | ||||||
| Group (1) | Group (2) | P value | ||||
| Count | % | Count | % | |||
| Ca score | Non | 24 | 32.0% | 33 | 44.0% | 0.104 |
| Minimal | 7 | 9.3% | 3 | 4.0% | ||
| Mild | 28 | 37.3% | 16 | 21.3% | ||
| Moderate | 12 | 16.0% | 16 | 21.3% | ||
| Severe | 4 | 5.3% | 7 | 9.3% | ||
The 150 patients that had MSCT for coronaries reveals that 45 patients (15 in group (1) “20.0%” vs 30 patients in group (2) “40.0%”) had No plaques with statistically significant difference (P = 0.008) in both groups. The other (105) patients had (122) plaques different in its composition which are classified as follow: Calcific plaque in group (1) 17 plaque “22.7%” vs 15 plaque “20.0%” in group (2) with No statistically significant difference between two groups (P = 0.690). Non-Calcific plaque in group (1) 11 plaque “14.7%” vs 19 plaques “25.3%” in group (2) with No statistically significant difference between two groups (P = 0.102). Mixed plaque in group (1) 42 plaques “56.0%” vs 18 plaques “24.0%” in group (2) with statistically significant difference between two groups (P ˂ 0.001) (Table 5) (Figure 1).
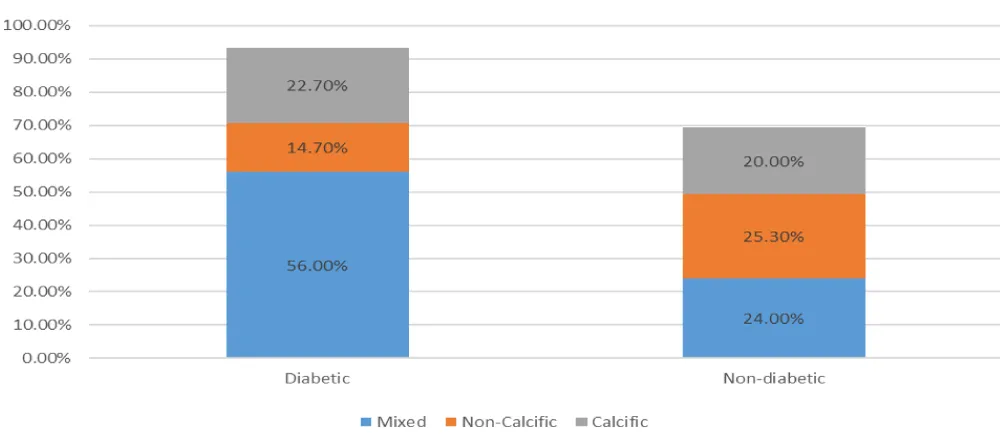
Figure 1: Comparison between types of plaque.
| Table 5: comparison between types of plaques. | |||||
| Group(1) | Group(2) | P value | |||
| Count | % | Count | % | ||
| No plaque | 15 | 20.0% | 30 | 40.0% | 0.008 |
| Calcific plaque | 17 | 22.7% | 15 | 20.0% | 0.690 |
| Non-Calcific plaque | 11 | 14.7% | 19 | 25.3% | 0.102 |
| Mixed plaque | 42 | 56.0% | 18 | 24.0% | <0.001 |
The results of multivariate logistic regression analysis after adjustment for age and sex, diabetics were shown a trend toward more mixed plaque with statistically significant {odds ratio (OR): 3.422, 95% CI 1.66-7.023, p = 0.001}; whereas, after adjustment for age, sex, history of hypertension, smoking, and hypercholesterolemia, patients with diabetes also shown a trend toward more mixed plaque with statistically significant (OR: 3.456, 95% CI 1.668-7.160, P = 0.001) (Table 6). OR: odds ratio, CI: confidence interval.
| Table 6: Multivariable adjusted analysis demonstrating the association between diabetes mellitus and the presence of plaques according to subtypes. | |||||
| P value | OR | 95% C.I. | |||
| Lower | Upper | ||||
| DM | Calcific model 1 | 0.906 | 1.050 | 0.467 | 2.362 |
| Calcific model 2 | 0.873 | 1.069 | 0.471 | 2.429 | |
| Non-calcified model 1 | 0.107 | 0.496 | 0.212 | 1.164 | |
| Non-calcified model 2 | 0.135 | 0.515 | 0.216 | 1.228 | |
| Mixed model 1 | 0.001 | 3.422 | 1.668 | 7.023 | |
| Mixed model 2 | 0.001 | 3.456 | 1.668 | 7.160 | |
| Model 1: Adjusted for age and gender. Model 2: Adjusted for age, gender, hypertension, smoking and hypercholesterolemia. | |||||
The final results that There was statistically significant difference between diabetics & non-diabetic groups in LM lesions with (P = 0.029) and also statistically significant differences in coronary atherosclerotic plaque burden and composition between diabetic and non-diabetic patients, with a higher proportion of mixed plaques, a more vulnerable form of atherosclerotic plaque, in diabetics (P < 0.001) otherwise No statistically significant difference between the two groups.
Atherosclerosis is a disease of the arterial wall that occurs at susceptible sites in the major conduit arteries. It is initiated by lipid retention, oxidation, and modification, which provoke chronic inflammation, ultimately causing thrombosis or stenosis. Atherosclerotic lesions can cause stenosis with potentially lethal distal ischemia or can trigger thrombotic occlusion of major conduit arteries to the heart, brain, legs, and other organs. Lesions begin in the inner lining of the arteries the intima and they progressively affect the entire arterial wall, including the media and the adventitia. Atherosclerosis has been a human disease for 3,500 years; it occurred in Egyptian mummies and showed the same pathologic features that are observed in modern times [9]. Endothelial function is attenuated in both type 1 and type 2 diabetes mellitus. Even short exposure to high glucose concentrations is sufficient to reduce NO bioavailability and endothelial dependent vasodilation [10]. Atherosclerosis is a disease of large and medium-sized arteries, characterized by endothelial dysfunction, vascular inflammation and the accumulation of modified lipid, inflammatory cells and cell debris in ‘plaques’ within the vascular wall. Plaques are usually found only at specific sites in the vasculature, such as curvatures and bifurcations, characterized by non-laminar (turbulent) flow and reduced shear stress. In these regions endothelial cells undergo endoplasmic reticulum stress with decreased athero-protective NO and increased superoxide production. This results in an increase in endothelial cell turnover, permeability and lipid accumulation in the sub-endothelial space [11]. Like intravascular ultrasound, MSCT is able to demonstrate pathology in the wall of the artery, and not just define obstruction of the lumen. In this manner, MSCT can often give a more total view of coronary pathology, including evaluation of the lumen the amount of soft, fatty plaque, and calcified plaque burden in the coronary vasculature [12]. The use of CCTA has been generally endorsed only for symptomatic low to-intermediate-risk patients by professional societal guidance documents [13]. Contrast-enhanced high-resolution computed tomography (CT) scans of the coronary arteries allow the evaluation not only of the degree of coronary stenosis, but also coronary plaque classification, coronary calcium scoring and epicardial fat volume evaluation [14]. Therefore, a high calcium score level was regarded as a surrogate marker for increased cardiovascular risk and events [15,16]. However, it is unclear how well the presence and amount of calcium can predict coronary events in various patient populations with different cardiovascular risk factors, such as diabetes.
The aim of this study was to evaluate the prevalence, extent and severity of disease regarding obstructive lesions and extent of atheromatous plaques throughout coronary segments, which suggests for development of CAD in this population by MSCT.
Results of the present study demonstrated an importance of diabetes for the detection of CAD severity and risk, and suggest the potential benefit of CAD evaluation in diabetic individuals. There are extensive evidences suggesting that autonomic dysfunction is associated with silent myocardial ischemia in diabetic patients, a finding that may mask clinical symptoms associated with the increased CAD extent and severity making screening of asymptomatic patients with long diabetes duration necessary [17].
In the present study, there was statistically significant difference between diabetics & non-diabetic groups (P = 0.029) in the prevalence of left main trunk and also The proportion of mixed plaques seen using MSCT angiography was larger in patients with diabetes when compared with patients without diabetes (P > 0.001). The results of multivariate logistic regression analysis after adjustment for age and sex, diabetics were shown a trend toward more mixed plaque with statistically significant {odds ratio (OR): 3.422, 95% CI 1.66-7.023, P = 0.001}; whereas, after adjustment for age, sex, history of hypertension, smoking, and hypercholesterolemia, patients with diabetes also shown a trend toward more mixed plaque with statistically significant (OR: 3.456, 95% CI 1.668-7.160, P = 0.001) [18]. Study agreed with the present study in which 416 symptomatic type 2 diabetic patients who had intermediate to high pre-test probability of obstructive CAD were enrolled in. this Study showed that diabetic patients had a higher proportion of coronary segments with mixed plaques compared with non-diabetic patients (1.67 ± 2.01 vs. 1.23 ± 1.61, P = 0.05) using MSCT angiography.
According to the study done by exploring invasive coronary plaque characterization on gray-scale IVUS in 654 patients, of which 128 had diabetes [19]. They reported a significantly larger plaque burden in diabetic patients. Increased plaque extent on MSCT angiography, as well as gray-scale IVUS, might explain a higher event rate in diabetic patients compared with non-diabetics.
Another study agreed with our study consist of 452 patients in the study. Only 92 patients who underwent both MSCT angiography and conventional coronary angiography, the patients who underwent invasive coronary angiography were evaluated for the presence and type of atherosclerotic plaque and severity of luminal narrowing [20]. The result revealed that Diabetic patients had more mixed plaque compared with non-diabetic patients When assessed according to types of coronary plaque (50% vs. 25.6%, P = 0.024).
Study disagreed with our study in total, 328 patients (254 men, mean age 56 ± 8 years), 42 with diabetes (type 2) and 286 without diabetes, were included in the study [21]. In diabetic patients, 231 coronary segments with atherosclerotic changes were observed: 27 (12%) were calcified plaques, 48 (21%) soft plaques, and 156 (67%) mixed plaques. In nondiabetic patients, coronary segments with plaques were found in 812 segments, of which 151 (19%) were calcified plaques, 261 (32%) were soft plaques, and 400 (49%) were mixed plaques. No differences in plaque composition between asymptomatic diabetic patients and nondiabetic patients were observed (P > 0.05), but this study is differing from our study in first, our patients were complaining or having symptoms in this study were asymptomatic, second the number of patients participating in the study in the two groups are equally in number in this study was (42 diabetics vs 286 nondiabetic patients).
MSCT angiography may be useful for the identification of CAD in diabetic and non-diabetic patients. There were significant differences in coronary atherosclerotic plaque burden and composition between diabetic and nondiabetic patients, with a higher proportion of mixed plaques, a more vulnerable form of atherosclerotic plaque in diabetics. Furthermore, MSCT angiography may give accurate information about plaque characteristics according to different coronary risk factors, thereby identifying high risk features warranting a more intensive anti-atherosclerotic treatment.
- Tomizawa N, Nojo T, Inoh S, Nakamura S. Difference of coronary artery disease severity, extent and plaque Characteristics between patients with hypertension d; mellitus dys-lipidemia. Int J Cardiovasc Imaging. 2015; 31: 205-212. PubMed: https://www.ncbi.nlm.nih.gov/pubmed/25262436
- Tomizawa N, Inoh S, Nojo T, Nakamura S. The association of hemoglobin A1c and high risk plaque and plaque extent assesed by MDCT. Int J Cardiovasc Imaging. 2016; 32: 493-500. PubMed: https://www.ncbi.nlm.nih.gov/pubmed/26463885
- Burgstahler C, Beck T, Reimann A, Kuettner A, Kopp AF, et al. Diagnostic accuracy of multislice computed tomography for the detection of coronary artery disease in diabetic patients. J Diabetes Complicat. 2007; 21: 69-746. PubMed: https://www.ncbi.nlm.nih.gov/pubmed/17331854
- Nakazato R, Arsanjani R, Achenbach S, et al. Age-related risk of major adverse cardiac event risk and coronary artery disease extent and severity by coronary CTangiography: results from 15,187 patients from the International Multisite CONFIRM Study. Eur Heart J Cardiovasc Imaging. 2014; 15: 586-594. PubMed: https://www.ncbi.nlm.nih.gov/pubmed/24714312
- Motoyama S. Computed tomographic angiography characteristics of atherosclerotic plaques subsequently resulting in acute coronary syndrome. J Am Coll Cardiol. 2009; 54: 49-57. PubMed: https://www.ncbi.nlm.nih.gov/pubmed/19555840
- Kim JJ, Hwang BH, Choi IJ, Choo EH, Lim S, et al. Impact of diabetes duration on the extent and severity of coronary atheroma burden and long-term clinical outcome in asymptomatic type 2 diabetic patients: evaluation by Coronary CT angiography. Eur Heart J Cardiovasc Imaging. 2015; 16: 606: 608. PubMed: https://www.ncbi.nlm.nih.gov/pubmed/26069244
- Kodama T, Kondo T, Oida A, Fujimoto S, Narula J. Computed tomographic angiography-verified plaque characteristics and slow-flow phenomenon during percutaneous coronary intervention. JACC Cardiovasc Interv. 2012; 5: 636-643. PubMed: https://www.ncbi.nlm.nih.gov/pubmed/22721658
- Agatston AS, Janowitz WR, Hildner FJ, Zusmer NR, Viamonte M Jr, et al. Quantification of coronary artery calcium using ultrafast computed tomography. J Am Coll Cardiol 1990; 15: 827-832. PubMed: https://www.ncbi.nlm.nih.gov/pubmed/2407762
- Deguchi JO, Aikawa M, Tung CH, et al. Inflammation in atherosclerosis: visualizing matrix metalloproteinase action in macrophages in vivo. Circulation. 2006; 114: 55-62. PubMed: https://www.ncbi.nlm.nih.gov/pubmed/16801460
- Ceriello A, Esposito K, Piconi L, Ihnat M, Thorpe J, et al. Glucose "peak" and glucose "spike": Impact on endothelial function and oxidative stress. Diabetes Res Clin Pract. 2008; 82: 262-267. PubMed: https://www.ncbi.nlm.nih.gov/pubmed/18950890
- Sima A, Stancu C, Simionescu M. Vascular endothelium in atherosclerosis. Cell Tissue Res. 2009; 335: 191-203. PubMed: https://www.ncbi.nlm.nih.gov/pubmed/18797930
- Komatsu S, Hirayama A, Omori Y, Ueda Y, Mizote I, et al. Detections of coronary plaque by computed tomography with a novel plaque analysis system, plaque map. And comparison with intravascular u/s and angioscopy. Circ J. 2005; 69: 72-77. PubMed: https://www.ncbi.nlm.nih.gov/pubmed/15635207
- Greenland P, Alpert JS, Beller GA et al. ACCF/AHA guideline for assessment of cardiovascular risk in asymptomatic adults. J Am Coll Cardiol. 2010; 56: 50-63.
- Wheeler G, Shi R, Beck S, Langefeld CD, Lenchik L, et al. Pericardial and visceral adipose tissues measured volumetrically with computed tomography are highly associated in type 2 diabetic families. Invest Radiol. 2005; 40: 97-101. PubMed: https://www.ncbi.nlm.nih.gov/pubmed/15654254
- Wayhs R, Zelinger A, Raggi P. High coronary artery calcium scores pose an extremely elevated risk for hard events. J Am Coll Cardiol 2002; 39: 225-230. PubMed: https://www.ncbi.nlm.nih.gov/pubmed/11788211
- Kim D, Choi SY, Choi EK, et al. Distribution of coronary artery calcification in an asymptomatic Korean population: association with risk factors of cardiovascular disease and metabolic syndrome. Korean Circ J. 2008; 38: 29-35.
- Hartmann A, Schlottog B, Jungmann E, et al. Somatic pain threshold and reactive hyperemia in autonomic diabetic neuropathy and silent myocardial ischemia. Int J Cardiol. 1993; 42: 121-127. PubMed: https://www.ncbi.nlm.nih.gov/pubmed/8112916
- Ibebuogu UN, Nasir K, Gopal A, Ahmadi N, Mao SS, et al. Comparison of atherosclerotic plaque burden and composition between diabetic and non diabetic patients by noninvasive CT angiography. Int J Cardiovasc Imaging. 2009; 25: 717-723. PubMed: https://www.ncbi.nlm.nih.gov/pubmed/19633998
- Nicholls SJ, Tuzcu EM, Crowe T, Sipahi I, Schoenhagen P, et al. Relationship between cardiovascular risk factors and atherosclerotic disease burden measured by intravascular ultrasound. J Am Coll Cardiol 2006; 47: 1967-1975. PubMed: https://www.ncbi.nlm.nih.gov/pubmed/16697312
- Kwon YS, Jang JS, Lee CW, Kim DK, Kim U et al. Comparison of Plaque Composition in Diabetic and Non-Diabetic Patients With Coronary Artery Disease Using Multislice CT Angiography. Korean Circ J. 2010; 40: 581-586. PubMed: https://www.ncbi.nlm.nih.gov/pubmed/21217935
- Zeina AR, Odeh M, Rosenschein U, Zaid G, Barmeir E. Coronary artery disease among asymptomatic diabetic and nondiabetic patients undergoing coronary computed tomography angiography. Coron Artery Dis. 2008; 19: 37-41. PubMed: https://www.ncbi.nlm.nih.gov/pubmed/18281814