
More Information
Submitted: 21 April 2020 | Approved: 08 June 2020 | Published: 09 June 2020
How to cite this article: Adinoyi SS. Assessment of cardiovascular and renal functions during treatment with Desmodium adscendens therapy. J Cardiol Cardiovasc Med. 2020; 5: 114-120.
DOI: 10.29328/journal.jccm.1001097
ORCiD: orcid.org/0000-0003-2267-2492
Copyright License: © 2020 Adinoyi SS. This is an open access article distributed under the Creative Commons Attribution License, which permits unrestricted use, distribution, and reproduction in any medium, provided the original work is properly cited.
Keywords: Creatinine; Urea; Desmodium adscendens; Glomerular filtration rate; Renal clearance; Serum electrolytes

Assessment of cardiovascular and renal functions during treatment with Desmodium adscendens therapy
Seriki Samuel Adinoyi*
Department of Physiology, College of Medical Sciences, Edo University, Iyamho, Nigeria
*Address for Correspondence: Seriki Samuel Adinoyi, Department of Physiology, College of Medical Sciences, Edo University, Iyamho, Nigeria, Tel: +234-8036041121; Email: [email protected]
Desmodium adscendens is a rain forest medicinal herb used in managing quite a number of medical conditions. Its efficacy in the treatment of several diseases has made it a first line herb for doctors, especially in managing all forms of spasm. It is however common knowledge that some of these medicinal herbs impact severely on the normal functioning of some vital organs of the body during their administration. The present study was carried out to assess the renal and cardiovascular performance in subjects undergoing treatment with Desmodium adscendens with a view to advising against its indiscriminate use. The parameters used for the assessment of renal functions were serum creatinine and urea concentrations and their clearance. Also, changes in electrolyte concentration of Sodium, Potassium and Chloride concentration were used to assess cardiovascular performance. The histology of the kidney and heart tissues was also done to determine if the extract has impact on the cyto-architecture of the organs. Twenty-four (24) wistar rats were used for the experiment. The rats were grouped randomly into four groups (n = 6). Group 1 served as control, and the rats in the group were given normal rat feeds and water. Group 2 served as low dose group, and rats in this group were administered with low dose of extract 300 mg/kg. Group 3 served as medium group, and rats in this group were treated with medium dose of extract, 450 mg/kg. Group 4 served as high dose group, and rats in this group were treated with high dose of extract 600 mg/kg. The extract was administered for 28 days. Result showed that the extract did not impact negatively on the normal function of the renal and cardiovascular system of the treated groups, rather it enhanced their performances. It can therefore be concluded that the extract is beneficial to renal and cardiovascular functions if used within the treatment dosage.
Desmodium adscendens is a rainforest herb which has been traditionally used to manage a wide variety of medical conditions including spasm, rheumatism, jaundice, hepatitis, asthma (owing to its bronchial-dilating effects). It’s of the Family - Fabaceae; and genus – Desmodium [1-3].
The therapeutic phytochemicals in Desmodium adscendens include alkaloids of the family of indolic, alkaloids flavonoids (such as astragalin, cosmosin), soyasaponins (such as dehydrosoyasaponin), and bioamine (tyramine). The plant contains about 4 mg/kg of alkaloids expressed in tryptamine. Fatty acids are present to a concentration of about 3%, which is relatively rich in unsaturated acids [4].
The triterpenoid glycosides (and other phytochemicals such as beta-phenylethylamines and tetrahydroisoquinolines) found in Desmodium adscendens are very potent potassium channel agonists. They activate the calcium-dependent potassium ion channels; when potassium ions cross the cell membranes, while the tone in the smooth muscles is maintained [4].
Renal and cardiovascular functions
The parameters commonly used for assessment of renal function are serum creatinine and urea concentrations and their clearance. Changes in electrolyte concentration of sodium, potassium and chloride ion concentrations are the ones commonly used to assess cardiovascular function.
Glomerular Filtration Rate (GFR) is the rate at which the kidneys produce filtrate from the blood passing through the glomerulus. In human, normal renal plasma flow is about 600 ml/minute, 20% of which yields a normal GFR of 120 ml/min. It is a parameter of prime clinical significance because it defines kidney function. All patients with reduced kidney function, whatever its cause, have reduced GFR and there is good correlation between GFR and severity of kidney disease.
The rate of decline in GFR distinguishes chronic kidney disease (CKD) and acute kidney injury (AKI). While CKD is associated with irreversible slow decline in GFR over time, AKI is associated with sudden steep decline in GFR over a period of hours or days, and it is potentially reversible [5-7].
Serum creatinine
Creatinine is a metabolic product of the dephosphorylation of creatine phosphate from the muscle. It occurs at a relatively constant rate (assuming stable muscle mass) and is excreted primarily by the kidneys with minimal tubular reabsorption. As such, any increase in serum creatinine can be used as a marker to identify patients with renal dysfunction, as it indicates a diminished ability of the kidneys to filter creatinine. Normal value of serum creatinine in human is 53–106 μmol/L or 0.5–1.5 mg/dL.
GFR and creatinine clearance
Glomerular filtration rate (GFR) is a frequently used as valuable measure of kidney function. Though Inulin clearance gives the most accurate estimate, the method is difficult and time consuming and can usually be replaced by creatinine clearance.
Creatinine accumulates in the blood when GFR decreases in the setting of renal dysfunction. As a result, serum creatinine levels are commonly used as a surrogate for GFR and renal function. Since renal dysfunction is a negative prognostic factor in patients with heart failure, elevations in serum creatinine levels are associated with poor outcomes in heart failure patients.
GFR is decreased in renal disease as creatinine clearance via the renal system is compromised. The reduced GFR will then lead to an increase in plasma creatinine concentration. The measurement of plasma creatinine alone should however not be used to assess renal function. Plasma creatinine levels may not be affected until significant renal damage has occurred [8].
Serum urea
Serum urea, commonly referred to as blood urea nitrogen (BUN), is a product of protein metabolism. BUN is considered a non-protein nitrogenous (NPN) waste product. Amino acids derived from the breakdown of protein are deaminated to produce ammonia. Ammonia is then converted to urea via liver enzymes. Therefore, the concentration of urea is dependent on protein intake, the body’s capacity to catabolize protein, and adequate excretion of urea by the renal system [9].
Urea accounts for the majority (up to 80% – 90%) of the NPNs excreted by the body. The body’s dependency on the renal system to excrete urea makes it a useful determinant of renal function. An increase in BUN can be the result of a diet that is high in protein content or decreased renal excretion.
The limitation of urea as a test of renal function is that in some cases plasma urea is not a sufficiently accurate reflection of GFR. It is not so sensitive, such that GFR may have reduced by around 50% before serum/plasma urea increases above the upper limit of the reference range [10].
Although not as specific as creatinine, BUN can also be used as an indicator of renal function. BUN is not the preferred marker for clearance because it is influenced by factors such as a high protein diet, variables in protein synthesis, and patient hydration status. Alone BUN is not the ideal marker for GFR, but combined with plasma creatinine as a creatinine/BUN ratio, BUN can be a useful analyte in differentiating pre or post renal increase of plasma NPNs [11].
Serum electrolytes
Serum electrolytes are salts and minerals, such as sodium, potassium, chloride, calcium etc, which are found in the blood, and conduct electrical impulses in the body. They could be higher or lower than the normal level it should be in the blood, sometimes resulting in serious health conditions [12].
Electrolyte disorders may be seen in patients with heart failure, seizures, and coma. These conditions may occur when serum electrolytes concentrations are either too high or too low. Their concentrations need to be balanced for the body to function properly [13].
When electrolyte concentrations vary from normal it could lead to stimulation of the renin-angiotensin-aldosterone system (RAAS), neurohormonal activation, and sometimes, cardiac glycosides [13].
Sodium ION
Sodium ion plays a very important role in regulating water balance in the body. Its normal serum level ranges from 130 to 145 mmol/L. Antidiuretic hormone (ADH) is a non-peptide hormone that regulates renal handling of free water. Alteration of the amount of water reabsorbed by the kidney has an important effect on serum sodium concentration. ADH secreted by the neurons in the supra-optic and paraventricular nuclei of the hypothalamus, is stimulated by hypovolemia, thirst, increased serum osmolality, and angiotensin II. Angiotensin II, which is a vasoconstrictor, enhances optimal perfusion pressure to end organs, especially when plasma volume is decreased [14].
Potassium IONs
Potassium represents an important ion of the human body. About 98% of the body’s potassium is present in the intracellular compartment, leading to a steep potassium concentration gradient across cellular membranes, indicating why potassium is particularly important to maintain the cellular membrane potential. It regulates the heart beat and function of muscles. Normal serum potassium level = 3.5-5.0 mEq/L. Potassium, along with sodium is involved with regulation of water and acid-base balance in blood and tissue. In mammals, the osmotic pressure and water distribution maintenance is the primary function of electrolytes like sodium and potassium. In addition, they play a role in maintenance of pH, in oxidation reduction reactions, in heart muscle functioning and as co-factors for enzymes [15].
Chloride ION
Chloride ion is the principal extracellular anion in humans with a concentration of about 95-110 mmol/L. It is passively absorbed from the upper small intestine and primarily regulated by the renal proximal tubules, where it is exchanged for bicarbonate ions and passively follows sodium and water through during renal tubular reabsorption by the nephron. Homeostatic mechanisms indirectly regulate Chloride ion through changes in sodium and bicarbonate. Being an anion, Sodium will balance out positive charges in the extracellular fluid, and by passively following sodium ion, it helps to maintain extracellular osmolality [16].
Aim of study
The study is designed to assess the effect of aqueous leaves extract of Desmodium adscendens on the normal renal and cardiovascular function in wistar rats.
Preparation of extract
Two (2) grams of the aqueous leaves extract of Desmodium adscendens was dissolved in 10ml of distilled water as follows; 2 g = 10 ml of water (200 mg = 1 ml). If 200 mg = 1 ml, therefore, 300 mg = 1.5 ml, 450 mg = 2.25 ml, and 600 mg = 3 ml of water. Volume per animal was determined as follows; for the low dose treated group, 300 mg of extract was dissolved in 1.5 ml of water. A rat in the low dose group with a body weight 120 g received 36mg of the extract. If 300 mg of extract was dissolved in 1.5 ml of water, 36 mg of the extract will be dissolved in 0.18 ml of water. Therefore, an animal in the low dose group with a body weight of 120 g will receive 0.18 ml of the extract daily all through the treatment period. Same was applicable to all the experimental animals in the extract treated groups.
Extract administration was done orally with the aid of an orogastric cannula and treatment lasted for four (4) weeks.
Experimental design
At the end of the acclimatization period, the animals were randomly assigned into four (4) groups, n = 6, as follows;
i. Control (Received normal rat chow and tap water)
ii. Low dose treated group (Received low dose of extract (300 mg/kg)
iii. Median dose treated group (Received middle dose of extract (450 mg/kg)
iv. High dose treated group (Received high dose of extract (600 mg/kg)
Treatments lasted for a period of four (4) weeks, all animals had free access to fed and water ad libitum.
Collection of blood samples: At the end of treatment period, animals from all the experimental groups were sedated and made unconscious using chloroform anesthesia. Blood samples from each rat were collected via cardiac puncture into EDTA sample bottles for the estimation of biochemical parameters. [17]
Determination of creatinine and blood urea nitrogen
Determination of creatinine: Creatinine is treated with picric acid in alkaline medium. Area colour develops which is measured calorimetrically. Over 85 percent colour is due to creatinine. Creatinine forms a yellow orange compound in alkaline solution with picric acid.
At low picric acid concentration used in this method a precipitation of protein does not take place. The concentration of the dyestuff form over a certain reaction time is a measure of the creatinine concentration.
As a result of the rapid reaction between creatinine and picric acid, later secondary section does not cause interference. This method thus distinguishes itself by its high specificity.
Stock creatinine standard - Dissolved 100 mg of pure dry creatinine in 100 ml 0.1 N-HCl (for 0.1 N. HCl) dilute 0.9 ml cone HCl to 100 ml with D. Water) the solution keeps well.
Determination of serum/blood urea nitrogen: Urea condenses with O - Phthalaldehyde and Naphtyl ethylene diamine to form an orange coloured complex. The rate of formation of this complex is directly proportional to urea concentration and is monitored on an initial rate (fixed time) mode at 505 nm.
Determination of serum electrolytes
Measurement of sodium and potassium: Serum Na+ and K+ was measured using flame photometer apparatus according to the method described by Hald [18].
Principle: Metals in solution dissociate to individual ions. These ions on the absorption of heat become excited to a higher energy level. When these excited ions fall back to their ground state they lose energy as light energy. The wave length emitted by this light energy is characteristic of a particular element (590 nm for sodium and 770 nm for potassium). Using a photomultiplier tube, the light energy is converted to an electrical pulse and the amount of current thus produced can be measured with a galvanometer or read out on a digital display as the concentration of that element in the solution.
Procedure: 10 ml of diluted Lithium standard was added into a universal container for the blank. For the test, 0.05 ml of the sample was added with 10ml of diluted Lithium standard. Standard solution, 0.05 ml with 10ml of Lithium standard was added to its container. The flame photometer was turned on and allowed to warm for 15 minutes. Later the equipment was zeroed with the blank. The equipment was standardized with the sodium and potassium standard. The test sample was then introduced through the aspirator and the concentration was read through the digital read-out.
Measurement of chloride
Serum Cl- ION was measured using the titration mercuric nitrate method.
Principle: Plasma filtrate such as that of folin was titrated with a mercuric nitrate solution, using diphenyl carbazone as an indicator, which gives a violet-purple complex with mercuric ions. Mercuric chloride is formed and remains in solution but is very slightly dissociated. Sufficient mercuric ions to give this colour are only present when all the chloride is titrated and excess mercuric nitrate is added.
The solution was mixed properly and titrated in a universal container with 0.01 N mercuric nitrate to a purple end point. Beyond the end point, it becomes pale yellow or colourless.
Calculation:
Histology
Histological examination of the Heart, Liver, and Kidney were done following the Hematoxylin and Eosin (H&E) technique.
Comparison of renal function parameters in the different experimental groups.
Serum urea
Figure 1 shows comparison of serum urea concentration in the different experimental groups. Result shows significant (p < 0.05) decrease in urea concentration in the groups given median and high doses of extract when compared with the control group. The group given high dose of extract also showed significant (p < 0.05) decrease in serum urea concentration when compared with the group given low and median dose of extract.
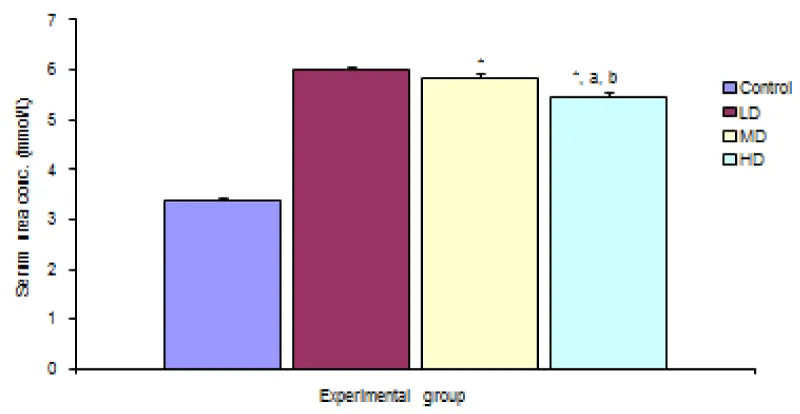
Figure 1: Comparison of serum urea concentration in the different experimental groups.
Values are expressed as mean + SEM, n = 6,
⊥ - Significantly/ different from control at p < 0.05
a - Significantly/ different from low dose at p < 0.05
b - Significantly/ different from median dose at p < 0.05
Figure 2 shows comparison of Serum Creatinine concentration in the different experimental groups. Result shows significant decrease in serum creatinine concentration in the groups given low, median and high doses of the extract when compared with the control (97.52 ± 0.25 µmol/L) group at p < 0.05. but the groups given median and high doses of the extract showed significant decrease in serum creatinine concentration compared with the group given low dose. The group given high dose of the extract showed significant increase in the creatinine concentration when compared with the group given media dose.
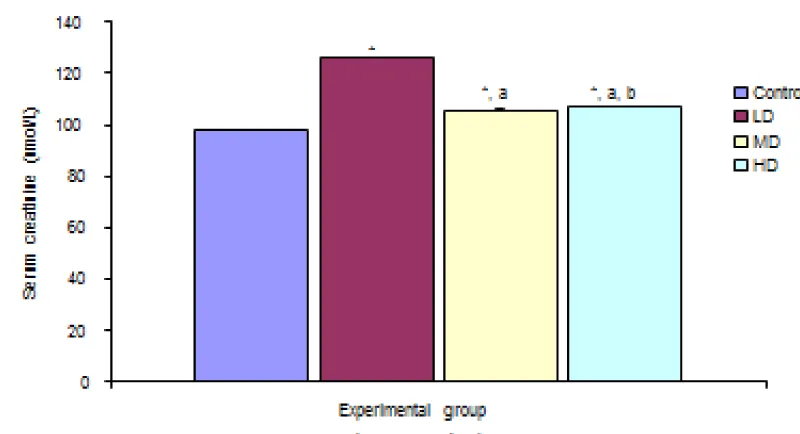
Figure 2: Comparison of serum creatinine concentration in the different experimental groups.
Values are expressed as mean + SEM, n = 6,
⊥ - Significantly/ different from control at p < 0.05
a - Significantly/ different from low dose at p < 0.05
b - Significantly/ different from median dose at p < 0.05
Comparison of serum electrolytes in the different experimental groups
Sodium ion concentration (Na+)
Desmodium adscendens extract caused significant (p < 0.05) decrease in Na+ concentration in the three groups given low, median and high doses of the extract when compared with the control (139.67 ± 0.48 mmol/L) group. Values for LD, MD and HD were 136.00 ± 0.97, 133.17 ± 0.48 and 135.67 ± 0.33 mmol/L respectively Figure 3.
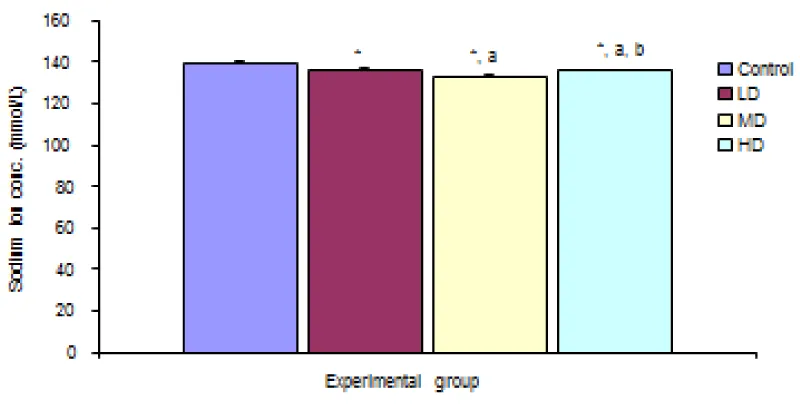
Figure 3: Comparison of sodium ION concentration in the different experimental groups.
Values are expressed as mean + SEM, n = 6,
⊥ - Significantly/ different from control at p < 0.05
a - Significantly/ different from low dose at p < 0.05
b - Significantly/ different from median dose at p < 0.05
Potassium ION concentration (K+)
There was significant increase in potassium ion concentration in the groups given medium and high doses of extract when compared with the control (5.43 ±0.08 mmol/L) and low dose (5.60 ± 0.06 mmol/L) groups. The group treated with high dose of the extract also showed significant increase in K+ concentration (6.97 ± 0.07 mmol/L) over the group given median dose. There was however no significant different in potassium ion concentration in the group given low dose of extract when compared with the control group Figure 4.
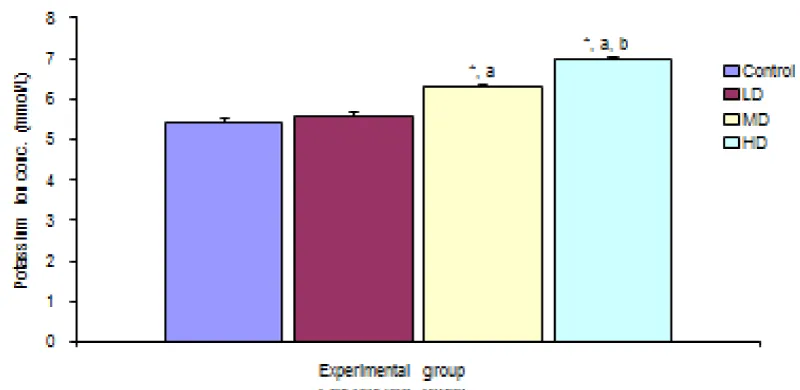
Figure 4: Comparison of Potassium ION concentration in the different experimental groups.
Values are expressed as mean + SEM, n = 6,
⊥ - Significantly/ different from control at p < 0.05
a - Significantly/ different from low dose at p < 0.05
b - Significantly/ different from median dose at p < 0.05
Chloride ION concentration (Cl-)
The comparison of Chloride ion concentration in the different experimental groups reveals a significant (p < 0.05) decrease in chloride ion concentration in the groups given low, median and high doses of the extract when compared with the control group (100.83 ± 0.40 mmol/L). Values for LD, MD and HD groups were 96.00 ± 0.58, 97.00 ± 0.84 and 95.00 ± 0.42 mmol/L respectively Figure 5.
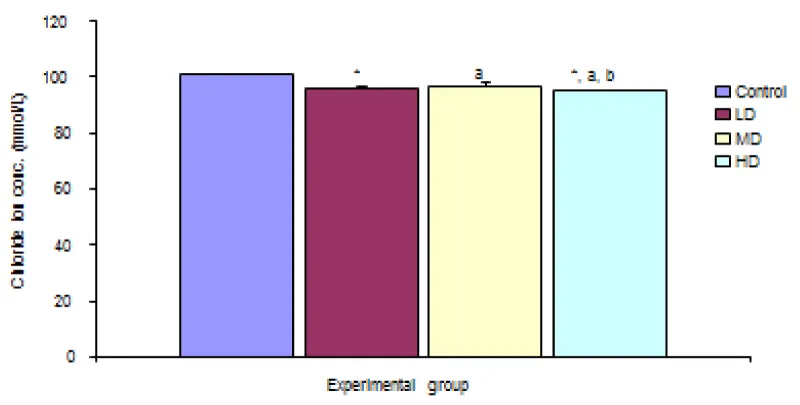
Figure 5: Comparison of chloride ION concentration in the different experimental groups.
Values are expressed as mean + SEM, n = 6,
⊥ - Significantly/ different from control at p < 0.05
a - Significantly/ different from low dose at p < 0.05
b - Significantly/ different from median dose at p < 0.05
Histology
Photomicrographs showed that the kidney and heart tissues were not adversely affected as there were no significant changes between control and experimental groups (Figures 6,7).
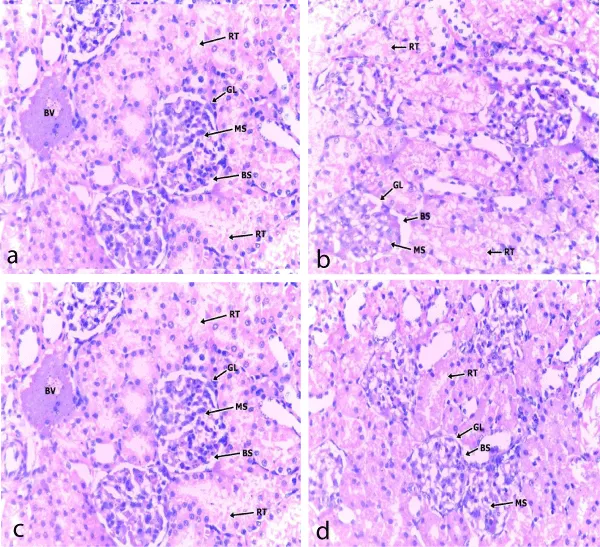
Figure 6: A section of cortical area of the kidney in; (a) control; (b) low dose; (c) median dose and (d) high dose extract fed groups. x 400, RT- Renal tubules; GL- Glomerulus, BS- Bowman space, MS- Messangium
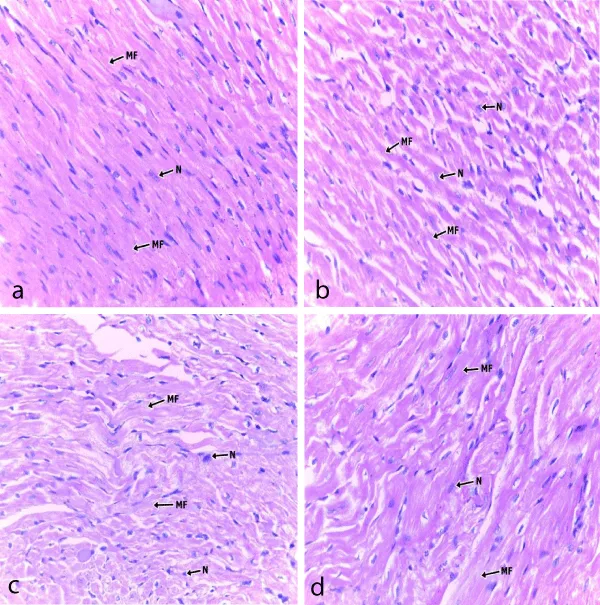
Figure 7: Photomicrograph of a section cardiac muscle in; (a) control; (b) low dose; (c) median dose group and (d) high dose extract fed groups. x400, MF- Muscle fibres; N- Nucleus.
Creatinine is derived mainly from muscle metabolism. It is therefore proportional to muscle mass and usually produced at a steadier rate for a given individual compared to urea. It is virtually all excreted by the kidneys. Plasma creatinine is used as a biomarker for renal function [19].
Its levels may go high due to renal impairment or failure, high dietary intake of meat, hypothyroidism, increased muscle mass, or increased protein intake [19].
The measurement of creatinine concentrations in plasma and urine samples illustrates the filtration capacity of the glomerulus, also known as the glomerular filtration rate (GFR). Creatinine is produced endogenously within the body and is freely filtered by the glomerulus. These characteristics make it a useful endogenous marker for creatinine clearance. If the GFR is decreased, as seen in renal disease, creatinine clearance via the renal system is compromised. The reduced GFR will then lead to an increase in plasma creatinine concentration.
Results of this experiment showed decreased serum creatinine level in the group treated with the extract of Desmoium adscendens, which could therefore indicate that the extract favoured renal function possibly by enhancing Glomerular Filtration Rate (GFR) helping in clearing creatinine from the plasma [20].
The measurement of plasma creatinine alone should however not be used to assess renal function because plasma creatinine levels may not be affected until significant renal damage has occurred. It is not a sensitive marker for changes in GFR when renal function is near normal. Also, an individual may lose 50% of normal GFR and have a borderline high creatinine, e.g 150 mcmol/L. Therefore when elevated serum creatinine is detected, it is important to evaluate the patient as a whole to rule out other possible causes.
In some laboratory reports, the creatinine clearance is also provided, as it is a better indicator of kidney function compared to serum creatinine alone. Alternatively, the creatinine clearance is commonly estimated from the serum creatinine using the Cockroft–Gault formula [21].
Although not as specific as creatinine, plasma urea clearance can also be used as an indicator of renal function. So increased plasma/serum urea can be caused by increased urea production, decreased urea elimination, or a combination of the two. It is not the most preferred marker for clearance because it is influenced by factors such as a high protein diet, variables in protein synthesis, and patient hydration status. Alone urea concentration may not be the ideal marker for GFR. But combined with plasma creatinine as a creatinine/urea ratio, it can be a useful determinant in differentiating pre or post renal increase of plasma non-protein nitrogens (NPNs) [22].
Results of the experiment also indicate decreased plasma urea concentration. This is a further confirmation that the extract of Desmodium adscendens enhances renal function.
Sodium and chloride ions decreased significantly in the treated groups. The experimental groups had significant increase in their serum potassium ion levels. This is beneficial, as high potassium helps to lower the arterial blood pressure by stabilizing the resting membrane potential. Potassium helps lower blood pressure by balancing out the negative effects of salt. The kidneys use a delicate balance of sodium and potassium to pull fluid across a wall of cell from the blood stream for excretion.
Serum sodium concentration also contributes substantially to blood pressure regulation. There is increasing evidence that small changes in plasma sodium may directly affect the hypothalamus, the local renin-angiotensin system, and the heart and vasculature, all of which may play a role in changing blood pressure independent of and additive to that which occurs with the tendency for the changes in extracellular volume. Small increases in plasma sodium may therefore be, in part, directly responsible for the elevated blood pressure.
Extracellular Cl− has been shown to be protective against fatigue, with implications for survival and cardiovascular risk, involving high-intensity contractions in both fast- and slow-twitch mammalian muscle possibly by preventing excessive depolarisation with exercise-induced decline in trans-sarcolemmal K+ gradient.
Elevated creatinine level and cardiovascular mortality
As earlier observed, an elevation in the serum creatinine concentration usually reflects a reduction in the glomerular filtration rate (GFR). Previous studies have shown that high prevalence of stress inducible ischemia, myocardial hypertrophy and the higher risk of both cardiac death and non-fatal myocardial infarction appear to be related to the eGFR decline.
Among traditional risk factors, hypertension and myocardial hypertrophy appear the most strongly associated with eGFR reduction [23]. This finding, expected for the dual relationship occurring between kidney and blood pressure, with a prominent role of the former in blood pressure homeostasis, and a major impact of hypertension in reducing renal function, might also help in explaining the prevalence of cardiac malfunction in compromised kidney performance.
The presence of reduced kidney function is known to be associated with a progressive decline in the indices of systolic function in both the patients with and without previous myocardial infarction (PMI). Cardiac hypertrophy was found to more prevalent among patients with reduced eGFR independently of the presence of age, gender and hypertension. It is therefore believed that Kidney malfunction affects cardiac performance through electrolyte imbalance, volume overload and negative inotropy [24].
Desmodium adsendens, enhances kidney performance and by extension also boosts cardiac functions by enhancing electrolyte balance. This is evident by the results of the serum electrolytes seen this research.
- Taylor L. The healing power of rainforest herbs. Square One Publishers. USA. 2005; 528.
- Evans WC. Trease and Evans Pharmacognosy. 15th edition, W.B. Sanders London. 2002; 419: 214-393.
- Addy ME. Some Secondary Plant Metabolites in Desmodium adscendens and their effects on Anaihidonic Acid Metabolism. Prostaglandins Leukotrienes Essent. Fatty Acids. 1997; 47: 85-91.PubMed: https://www.ncbi.nlm.nih.gov/pubmed/1438471
- Seriki SA, Odetola OA, Adebayo OF. Analysis of Phytoconstituents of Desmodium adscendens in Relation to its Therapeutic Properties. Am J Biomed Sci Res. 2019; 249 .
- Ferenbach DA, Bonventre JV. Acute kidney injury and chronic kidney disease: from the laboratory to the clinic. Nephrologie & Therapeutique. 2016; 12(suppl 1): S41-S48. PubMed: https://www.ncbi.nlm.nih.gov/pmc/articles/PMC5475438/
- Kellum JA, Lameire N. KDIGO Clinical Practice Guideline for Acute Kidney Injury. Kidney International Supplements. 2012: 2: suppl1.
- Levey AS, Inker LA. Definition and staging of chronic kidney disease in adults. Up To Date. 2018. from https://www.uptodate.com/contents/definition-and-staging-of-chronic-kidney-disease-in-adults
- Miltuninovic J, Cutler R, Hoover P, Meijsen B, Scribner B. Measurement of residual glomerular filtration rate in the patient receiving repetitive hemodialysis. Kidney Int. 1975; 8: 185–190. PubMed: https://www.ncbi.nlm.nih.gov/pubmed/1177378
- Kurzer F. Urea in the history of organic chemistry: Isolation from natural sources. J Chem Educ. 1956; 33, 9: 452-59.
- Baum N. Blood urea nitrogen and serum creatinine. Urology. 1975; 5, 5: 583-588. PubMed: https://www.ncbi.nlm.nih.gov/pubmed/1093306
- Maroni B, Steinman T, Mitch W. A method for estimating nitrogen intake of patients with chronic renal failure. Kidney Int. 1985; 27: 58-65. PubMed: https://pubmed.ncbi.nlm.nih.gov/3981873
- Adinoyi SS, Oluwagbamila OB, Ademola AO. Role of Moringa oleifera on Electrolytes Levels and Cardiovascular Function in Human. Therapeutic Adv Cardiol. 2017; 1: 80-86.
- Endemann DH, Pu Q, De Ciuceis C, Savoia C, Virdis A, et al. Persistent remodeling of resistance arteries in type 2 diabetic patients on antihypertensive treatment. Hypertension. 2004; 43: 399-404. PubMed: https://www.ncbi.nlm.nih.gov/pubmed/14707158
- Huang A, Luethi N, Martensson J, Bellomo R, Cioccari L. Pharmacodynamics of intravenous frusemide bolus in critically ill patients. Critical Care Resuscitation. 2017; 19: 142–149. PubMed: https://www.ncbi.nlm.nih.gov/pubmed/28651510
- Asano S, Kato E, Yamauchi M, Ozawa Y, Iwasa M. The mechanism of acidosis caused by infusion of saline solution. Lancet. 1966; 1: 1245–1246. PubMed: https://www.ncbi.nlm.nih.gov/pubmed/4161214
- Shires GT, Holman J. Dilution acidosis. Ann Intern Med. 1948; 28: 557–559. PubMed: https://www.ncbi.nlm.nih.gov/pubmed/18905223
- Trease GE, Evans WC. Pharmacognosy 12th Ed. 1984. Bailliere Tindal, London: 622.
- Hald PM. The flame photometer for the measurement of sodium and potassium in biological materials. J Biol Chemistry 1946; 167: 499 – 510. PubMed: https://www.ncbi.nlm.nih.gov/pubmed/20285045
- Molitch ME, Rodman E, Hirsch CA, Dubinsky E. Spurious serum creatinine elevations in ketoacidosis. Ann Intern Med. 1980; 93: 280–281. PubMed: https://www.ncbi.nlm.nih.gov/pubmed/6773457
- Miltuninovic J, Cutler R, Hoover P, Meijsen B, Scribner B. Measurement of residual glomerular filtration rate in the patient receiving repetitive hemodialysis. Kidney Int. 1975; 8: 185–190. PubMed: https://www.ncbi.nlm.nih.gov/pubmed/1177378
- Andreev E. A rise in plasma creatinine that is not a sign of renal failure: which drugs can be responsible? J Intern Med. 1999; 246: 247-252. PubMed: https://pubmed.ncbi.nlm.nih.gov/10475992
- Maroni B, Steinman T, Mitch W. A method for estimating nitrogen intake of patients with chronic renal failure. Kidney Int. 1985; 27: 58-65. PubMed: https://pubmed.ncbi.nlm.nih.gov/3981873
- Zimmermann J, Herrlinger S, Pruy A, Metzger T, Wanner C. Inflammation enhances cardiovascular risk and mortality in hemodialysis patients. Kidney Int. 1999; 55: 648–658. PubMed: https://www.ncbi.nlm.nih.gov/pubmed/9987089
- Angeles C, Lane BP, Miller F, Nord EP. Fenofibrate-associated reversible acute allograft dysfunction in 3 renal transplant recipients: biopsy evidence of tubular toxicity. Am J Kidney Dis. 2004; 44: 543–550. PubMed. https://www.ncbi.nlm.nih.gov/pubmed/15332227