
More Information
Submitted: February 11, 2021 | Approved: March 23, 2021 | Published: March 24, 2021
How to cite this article: Castellanos AM. Abdominal obesity in predicting myocardial infarction risk. Waist-to-Hip Ratio: The metric that confused cardiology worldwide for a long time. J Cardiol Cardiovasc Med. 2021; 6: 026-028.
DOI: 10.29328/journal.jccm.1001113
Copyright License: © 2021 Castellanos AM. This is an open access article distributed under the Creative Commons Attribution License, which permits unrestricted use, distribution, and reproduction in any medium, provided the original work is properly cited.

Abdominal obesity in predicting myocardial infarction risk. Waist-to-Hip Ratio: The metric that confused cardiology worldwide for a long time
Angel Martin Castellanos1,2*
1Nutrition and Sports Medicine Center, Caceres, Spain
2Department of Anatomy, Research Group, Bio-Anthropology and Cardiovascular Sciences, University of Extremadura, Faculty of Nursing and Occupational Therapy, Caceres, Spain
*Address for Correspondence: Angel Martin Castellanos, Nutrition and Sports Medicine Center & Department of Anatomy. Research Group, Bio-Anthropology and Cardiovascular Sciences, University of Extremadura, Faculty of Nursing and Occupational Therapy, Caceres, Spain, Tel: +34680415930; Email: [email protected]
Important differences has been found in assessing the effects of obesity on cardiovascular disease (CVD) risk [1]. Interestingly, accurate estimation of the body composition (BC) is highly relevant from a public health perspective [2], and it has the importance of being essential in establishing the impact of adiposity on increased myocardial infarction (MI) risk. However, in non-randomized studies, baseline differences of BC between groups to be compared may introduce bias in results.
From INTERHEART study, waist-to-hip ratio (WHR) has been deemed as an excellent MI risk predictor [3-5], and results from UK Biobank have conferred it a greater excess risk in women than in men [6]. However, evidence supports that a higher waist circumference (WC) reflects an elevated risk of major cardiovascular outcomes [7]. Additionally, bias for WHR have been revealed due to protective overestimation for HC concerning WC and height [8,9]. Hence, a different BC between groups with similar baseline confounding variables may provide bias in outcomes if the risk assignment does not account for the covariates that predict receiving true-risk. Thus, as a result, risk assignment for WHR may be systematically biased if WC and hip circumference (HC) are not controlled in data analysis to preclude the same risk assignment between subjects who have equal WHR, but not necessarily referring to the same whole-risk.
Thinking about a mathematical misconception when WHR was compared to WC in all previous studies, our aim was to demonstrate whether association of WHR and MI may provide bias. Firstly, WC and HC express no equality for whole-risk as mathematical object. Secondly, in any ethnicity and sex, standard human body is formed by a HC higher than WC (WHR < 1) without involving any putative risk or protective effect (Figure 1). Thereby, HC > WC is a natural inequality satisfying a true premise: HC = WC + x, where subtracting HC by WC we calculate “x” ((X >0) as unit of length (cm), and being their standard value higher in women than in men. Thus, only when “x” is mathematically zero there is equality (WC = HC; WHR = 1) for whole-risk conclusion to be certain. Obviously, when “x” is < 0 (WHR > 1) conclusion for whole-risk holds true. Nevertheless, WHR < 1 is a proper fraction whose decimal value tell us the equal parts of WC that we have in HC, but it demonstrates not whole-risk beyond that of WC. Thus, in our previous research [8,9] WHR < 1 has always marked different individuals and proper fractions there where HC = WC + x, being always “x” of > 0. As an example 94/99 vs. 95/100 vs. 100/105, etc., = 0.95; 94/96.9 vs. 98/100.9 vs. 102/104.9, etc., = 0.97; 94.2/94.3 vs. 96/96.1 vs. 100/100.1, etc., = 0.99; there would be five type of values for WHR between 0.95 and 0.99 and infinite fractions for “x” between 5 and 0.1: HC > WC in all). However, biologically there were a true-risk when WC predicted receiving whole-risk (WC ≥ defined cutoff: 94.4) and another one spurious when WC receiving a false-risk (WC below their cutoff). Hence, dividing WC by HC gave us a fraction, at least between the lowest and 0.99 value, there where WHR was simply a way of representing size that was not whole-risk. On this approach, WHR would be a confounding variable with whole-risk conditioned on WC “x” distance and the estimate of risk for HC concerning WC [9].
Completing our research line, a case-control study to demonstrate biases was evaluated on a sample of MI men (n = 252). The minimum sample size for calculating was of 90 cases and at least 1 control per case, with obesity exposition and statistical power of 22% and 0.99, respectively. Measurements, strength of association and risk cutoffs for WC (≥ 94.4 cm), WHR (≥ 0.95) and WHtR (≥ 0.54) were consonant with those of large studies [3-9,12]. However, for the first time stratification as approach for removing bias effect was used. We created a baseline covariate (WHR0.95-0.99) from a new matched sample in the stratum between 0.95 and 0.99 value for coinciding on the overlap area of the distribution and there where all subjects had a similar propensity score, and therefore, they should have the same risk distribution. Consequently, we considered other baseline covariate with binary outcomes for a spurious-risk assignment (WHRs). It was conditioned defining spurious-risk there where WC took a value below their cutoff, and besides, being lower than HC.
From results, WHR showed the strongest association, but WHR0.95-0.99 presenting no significant between-group difference. By contrast, WHRs showed double prevalence in cases, what indicated a risk assignment wrong due to slanted arithmetic data in an artificial direction. WHR < 1 and “x” > 0 were independently associated to control group as anthropometrically expected. Thereby, accepting WHR < 1 as entity of whole-risk was a false premise. Besides, in a Cartesian system WC and HC only may coincide on the same estimate of risk when WC takes the same value as HC (WHR = 1, Figure 1). Accordingly, selected risk points for WHR < 1 yielded a misclassification respect to WC because HC did not account for the same estimate of risk as WC, and only when WC (numerator) proved whole-risk WHR < 1-assigned risk had solid validity. Anthropometrically, between WHR cutoff and 0.99 value we always find protective overestimation for HC, and therefore, systematic bias occurs for making impossible the validity of WHR above WC alone, even when “x” being between 0.1 and 1 and WHR = 0.99 accounting for 10 values of “x”.
Surprisingly, most studies in predicting MI and mortality risk always showed a WHR cutoff < 1 in both sex, while selection biases were never discussed [3-6,10-12]. Indisputably, “x” was always a higher positive value in women and middle-aged than in men and elderly, respectively [2-5,10,12], and therefore, WHR cutoffs were always lower in the first two compared to the seconds. This means longer range up to 0.99 for involving higher possibility of bias in women and middle-aged due to a higher number of fractions where selection bias for WHR will always occurred [3-6,10-12]. In this line, WC and WHR would mathematically be equivalent for the same whole-risk, if and only if HC = WC, and therefore, WHR = 1 would be the entity of whole-risk exclusively depending on WC, and besides, HC taking the same value as HC. If not, error of estimate for the true-BC at risk may occur in comparing WC alone with WHR, and either by age or by sex. Therefore, if HC > WC (WHR risk cutoff < 1) protective overestimation occurs for HC respect to WC, and the lower the WHR cutoff (e.g. in women), the higher the risk overestimation for WHR as compared to WC. It is mathematically clear, in any anthropometric-risk evaluation where baseline characteristics for WHR and WHR risk cutoff are of < 1 WC alone turn out to be the entity of whole-risk to be compared, but never WHR performing better than WC, except accepting biased results.
This research has the strength of demonstrating bias for WHR when mathematically thinking about risk cutoffs < 1. These findings determine the generalizability to other ethnically-based or sex-specific populations if mathematically satisfy the same observation for WHR-associated risk, even finding higher hazard ratio in women compared to men [4,6,12]. As theoretical limitation, this won’t be applicable to populations not included in derivation cohort along with others not compared. Nevertheless, all WHR-associated risk above WC, as being mathematically incorrect provides to cardiology false epidemiological conclusions worldwide. It is time of avoiding an unnecessary and confounding anthropometric where HC renders clinically useless.
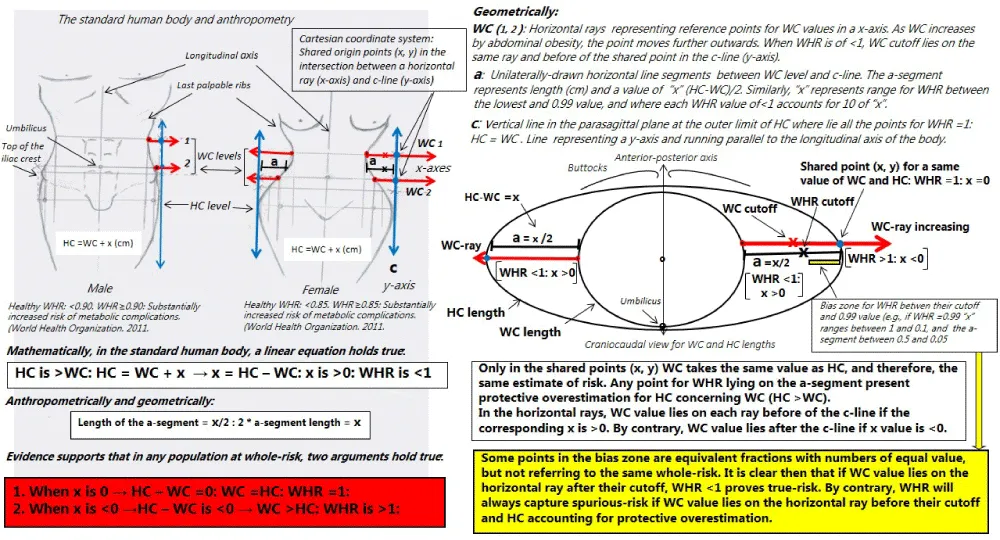
Figure 1: Original assembly from anthropometric models and geometric lines on the standard human body. Geometrical and mathematical demonstrations for a correct anthropometric assessment of the abdominal obesity and CVD risk. Drawings representing the human body (both sexes) where metrics would be sample mean values per standard deviation for WC, HC and WHR being actually valid for any anthropometrically healthy population and ethnicity. In the respective lines drawn would lie points of increased abdominal obesity representing mean values for thousands of cases of CVD as well as biological changes pointing towards greater excess risk of CVD as WC increases. Similarly, the corresponding cut-off points associated per standard deviation, or quintiles, quartiles/tertiles or Receiver Operating Characteristic analysis for WC and WHR will always lie before of the c-line. The anthropometric models and schemes are valid for both case-control and cohort studies, and any type of cardiovascular event. Explanations for understanding, in text. Names of lines and rays, where appropriate. The origin of the horizontal rays represent the same level of measurement for WC. CVD, cardiovascular disease; HC, hip circumference; WC, waist circumference; WHR waist-to-hip ratio.
- Lassale C, Tzoulaki I, Moons KGM, Sweeting M, Boer J, et al. Separate and combined associations of obesity and metabolic health with coronary heart disease: a pan-European case-cohort analysis. Eur Heart J. 2018; 39: 397-406. PubMed: https://pubmed.ncbi.nlm.nih.gov/29020414/
- Cornier MA, Després JP, Davis N, Grossniklaus DA, Klein S, et al. Assessing adiposity: a scientific statement from the American Heart Association. Circulation. 2011; 124: 1996–2019. PubMed: https://pubmed.ncbi.nlm.nih.gov/21947291/
- Yusuf S, Hawken S, Ounpuu S. Effect of potentially modifiable risk factors associated with myocardial infarction in 52 countries (the INTERHEART study): case-control study. Lancet. 2004; 364: 937-952. PubMed: https://pubmed.ncbi.nlm.nih.gov/15364185/
- Egeland GM, Igland J, Vollset SE, Sulo G, Eide GE, et al. High population attributable fractions of myocardial infarction associated with waist-hip ratio. Obesity. 2016; 24:1162-1169. PubMed: https://pubmed.ncbi.nlm.nih.gov/27030172/
- Cao Q, Yu S, Xiong W, Li Y, Li H, et al. Waist-hip ratio as a predictor of myocardial infarction risk. A systematic review and meta-analysis. Medicine (Baltimore). 2018; 97: e11639. PubMed: https://pubmed.ncbi.nlm.nih.gov/30045310/
- Peters SAE, Bots SH, Woodward M. Sex Differences in the Association Between Measures of General and Central Adiposity and the Risk of Myocardial Infarction: Results From the UK Biobank. J Am Heart Assoc. 2018; 7. pii: e008507. PubMed: https://pubmed.ncbi.nlm.nih.gov/29490971 /
- Choi D, Choi S, Son JS, Oh SW, Park SM, et al. Impact of Discrepancies in General and Abdominal Obesity on Major Adverse Cardiac Events. J Am Heart Assoc. 2019; 8: e013471. PubMed: https://pubmed.ncbi.nlm.nih.gov/31480883/
- Martin-Castellanos A, Cabañas-Armesilla MD, Barca-Durán FJ, Castellanos PM, Barrado JJG, et al. Obesity and risk of Myocardial Infarction in a Sample of European Males. Waist To-Hip-Ratio Presents Information Bias of the Real Risk of Abdominal Obesity. Nutr Hosp. 2017; 34: 88-95. PubMed: https://pubmed.ncbi.nlm.nih.gov/28244777/
- Martin-Castellanos A, Cabañas MD, Martín-Castellanos P, et al. The body composition and risk prediction in myocardial infarction men. Revealing biological and statistical error bias for both general obesity and waist-to-hip ratio. Card Res Med. 2018; 2: 13-20.
- World Health Organization. Waist circumference and waist-hip ratio: report of a WHO expert consultation, Geneva, 8-11 December 2008. World Health Organization 2011. http://www.who.int/iris/handle/10665/44583
- Rost S, Freuer D, Peters A, Thorand B, Holle R, et al. New indexes of body fat distribution and sex-specific risk of total and cause-specific mortality: a prospective cohort study. BMC Public Health. 2018; 18: 427. PubMed: https://pubmed.ncbi.nlm.nih.gov/29609587/
- Medina-Inojosa JR, Batsis JA, Supervia M, Somers VK, Thomas RJ, et al. Relation of Waist-Hip Ratio to Long-Term Cardiovascular Events in Patients With Coronary Artery Disease. Am J Cardiol. 2018; 121: 903-909. PubMed: https://pubmed.ncbi.nlm.nih.gov/29482851/