
More Information
Submitted: August 10, 2022 | Approved: August 29, 2022 | Published: August 30, 2022
How to cite this article: Lhendup K, Penjore Y. An empirical study on factors responsible for Rheumatic Heart Disease (RHD) and its severity levels amongst the Bhutanese populace. J Cardiol Cardiovasc Med. 2022; 7: 068-073.
DOI: 10.29328/journal.jccm.1001136
Copyright License: © 2022 Lhendup K, et al. This is an open access article distributed under the Creative Commons Attribution License, which permits unrestricted use, distribution, and reproduction in any medium, provided the original work is properly cited.
Keywords: Transvenous lead extraction; Intracardiac echocardiography; Cardiac implantable devices

An empirical study on factors responsible for Rheumatic Heart Disease (RHD) and its severity levels amongst the Bhutanese populace
Karma Lhendup1* and Yeshey Penjore2
1Department of Economics, Nanjing University of Information Science and Technology (NUIST) Reading Academy, Jiangsu, Nanjing, China
2Jigme Dorji Wangchuck National Referal Hospital (JDWNRH), Thimphu, Bhutan
*Address for Correspondence: Karma Lhendup, Lecturer, Department of Economics, Nanjing University of Information Science and Technology (NUIST) Reading Academy, Jiangsu, Nanjing, China, Email: [email protected]
Background and objectives: This paper is aimed at excavating the factors responsible for RHD events and vis-à-vis establishing severity levels of RHD patients referred to Jigme Dorji Wangchuck National Referral Hospital (JDWNRH) in Thimphu’s capital city of Bhutan.
Methods: By taking notorious advantage of the data gathered over the past five years (2016-2020) from RHD patients across 20 districts of Bhutan, about 232 RHD patients are involved in this study recorded in JDWNRH by the Cardiology Department. Besides descriptive methods, multivariate linear regression models augmented by the multinomial logistic regression models had been applied to establish the causual links.
Results: The findings revealed that RHD prevailed amongst the young populace of Bhutan, especially females. Variables like age, frequency of visits, number of diagnostics, levels of education and region had been found as predictors of RHD prevalence. Other socio-demographic factors like occupation and status of employment did not affect the RHD prevalence. The multinomial logistic regression results indicated that higher levels of education as an important factor for not making the patient fall into the category of ‘severe.’ Age has been constantly found to be a highly significant variable contributing to RHD events and a quadratic relationship is revealed between age and the severity of RHD.
Conclusion and implications for translation: This study pigeonholed the significant factors responsible for RHD events and entailed severity levels by gender and age. The findings of this study also provide additional important insights into developing public health policies and programs.
Cardiovascular Disease (CVD) is a communal concern for people from all walks of life. CVD is a generic term used for all diseases and conditions associated with heart and blood vessels [1]. The Department of Medical Record, Jigme Dorji Wangchuck National Referral Hospital (JDWNRH) in Thimphu’s capital city of Bhutan recorded 5,206 CVD patients in the past eleven years (2006-2016) [2].
Rheumatic Heart Disease (RHD) is one of the serious subtypes of CVD that has caused cardiovascular morbidity and mortality in the young populace in developing economies [3]. RHD is regarded as a serious subtype of CVD pioneered by an Acute Rheumatic Fever (ARF) involving damage to one or more of the four small heart valves. Marijon, et al. [3] and Auala, et al. [4] also stated that “RHD results from an abnormal autoimmune response to a group A streptococcal infection in a genetically susceptible host.” In Bhutan, a total of 232 RHD patients have reported to JDWNRH over the past five years (2016-2020), and this study aimed at studying the factors associated with RHD events. So far there is a dearth of such research carried out as a particular case in Bhutan besides the study, ‘Identification of survival curve involving risk factors for CVD patients’ by Dorji and Tiensuwan [2]. Therefore, findings from this study might enrich the RHD literature as a particular case in Bhutan and vis-à-vis enable the JDWNRH to screen the endemic areas through early detection of the population at risk from RHD and accordingly target treatments.
Study participants
The data maintained by the Department of Cardiology, JDWNRH over the past five years is considered in this study. Precisely, a sum of 232 RHD patients from various 20 districts had been involved in this study.
Specification of variables
Bhutan as a least developed economy lacks both resources and research culture. To this effect, the variables that are of utmost importance for establishing the causal links between dependent and independent variables under consideration may not have adequately been captured. Nonetheless, sizable independent variables viz. age, gender, district the patient reported from and severity of the RHD is retrieved from the administrative records and employed for this study. The dependent variable is a categorical variable with three categories of severity: severe RHD; moderate RHD; and mild RHD.
Statistical analysis
The data pertaining to all 232 RHD patients are considered in this study and two regression models namely multinomial logistic regression and multivariate linear regression are employed to establish the causal relationships between the dependent variables and the independent variables. The former is employed to check the degrees (mild, moderate & severe) of RHD prevalence amongst different age brackets of the RHD patients and the latter for establishing the factors influencing RHD. The quadratic relationship between the age of the patients and the RHD prevalence is also established in this study. In a nutshell, both descriptive and empirical analyses are presented in this research. The multinomial logistic regression model is used for data in which the dependent variable is not in order and is either dichotomous or polytomous. In this study, the dependent variable comprises three variables viz. mild RHD, moderate RHD and severe RHD, which are categorical predictors [5]. One of the aforementioned categories (moderate) of severity is taken as the reference category, which the Stata software automatically eliminates as a base outcome.
For dependent variables with ‘j’ categories, the ‘j-1’ equations need to be computed—one for each category relative to the reference category, to describe the relationship between the dependent variable and the independent variables (Menard, 2002; Borooah, 2002; Starkweather & Moske, 2011). To this effect, if the first category is the reference, then, for j=2, …., J,
Hence, for each case, there will be J-1 predicted log odds—one for each category relative to the reference category. When j=1, one get ln(1) = 0=Z11 and exp(0)=1.
For j=2,…, J,
For the reference category,
Similarly, the second model employed in this study is a multivariate regression model depicted below.
, where Y is a dependent variable (RHD event), Xi’s are independent variables, Dij is dummies, α0 is an intercept and Ԑ is a stochastic error.
In this study, both SPSS version 22 and Stata 13 are used interchangeably for practical purposes. The SPSS was used to generate descriptive statistics, which is comparatively easier in this software. In a similar vein, Stata by virtue of its being robust and handy was used for running regressional analysis.
Socio-demographic characteristics
This section deals with the basic socio-demographic characteristics of RHD patients. The majority of the RHD patients were females (68.1%) and the median age was 35. Upon segregation by age distributions, half (50%) of the RHD patients belonged to the age bracket of 16-36 followed by around 20% of them falling in the age bracket of 37 - 47. Close to 10% of them fell in the age cohort of 59-68. An equal proportion (3.9%) of the youngest (aged below 15 years) and oldest (aged above 69 years) patients have as well reported as RHD patients. Most of the patients (37.1%) had a primary level of education followed by about 32.3% of them with no education. More than half (59.5%) of the patients were farmers and most of them (37.9%) come from the central part of Bhutan. Considering the employment status of the RHD patients, a little more than half (57.3%) of them were employed.
Baseline characteristics of patients
As illustrated in Table 1, the baseline characteristics of RHD patients are categorized into three age levels. About 18.5 percent of the patients were females aged 25 years and below, 35.8% aged 26-52 years and 13.8% aged 53 years and older. In a similar vein, the frequency of visits by those patients was categorized into three groups. The frequency of visits by the age cohort, 25 years and below is found to be 71.6% (1 Time), 16.4% (2 Times) and 11.9% (3 Times) respectively. Similarly, for those falling in the age bracket of 26-52, the frequency of visits was found to be 69.7% (1 Time), 18.5% (2 Times) and 11.8% (3 Times) respectively. From these aforementioned proportions, the frequency of visits to the hospital by the RHD patients clearly indicated that patients with fewer complications fell into the category of ‘1 Time’ visitors. By the same token, most of the patients fell into the category of moderate level of severity.
The RHD is not a lone complication and has many forebears viz. Mitral Stenosis (MS), Mitral Regurgitation (MR), Aortic Stenosis (AS), Aortic Regurgitation (AR), Tricuspid Regurgitation (TR), Pulmonary Regurgitation (PR), Atrial Fibrillation (AF), Congestive Heart Failure (CHF) and others. In this study, the result revealed that the RHD patients were accompanied by up to 5 diagnostics. However, the majority of them fell into the category of ‘1 Disease’ and ‘2 Diseases.’
Prevalence of RHD
Figure 1 depicts the prevalence of RHD by age distribution. It also illustrates the quadratic relationship between age and the severity level of RHD. The prevalence rate of RHD severity is reported highest (29.7%) in the age cohort of 16-28 years followed by 29-41 (28.9%). The lowest prevalence rate is revealed amongst the aged 67 and older and 15 and below with a respective prevalence rate of 5.2% and 3.9%. Figure 1 as well shows that as the age keeps on increasing, the severity level increases and reaches a certain height and then starts to decline. This shows that there is an optimal point that maximizes the severity of RHD.
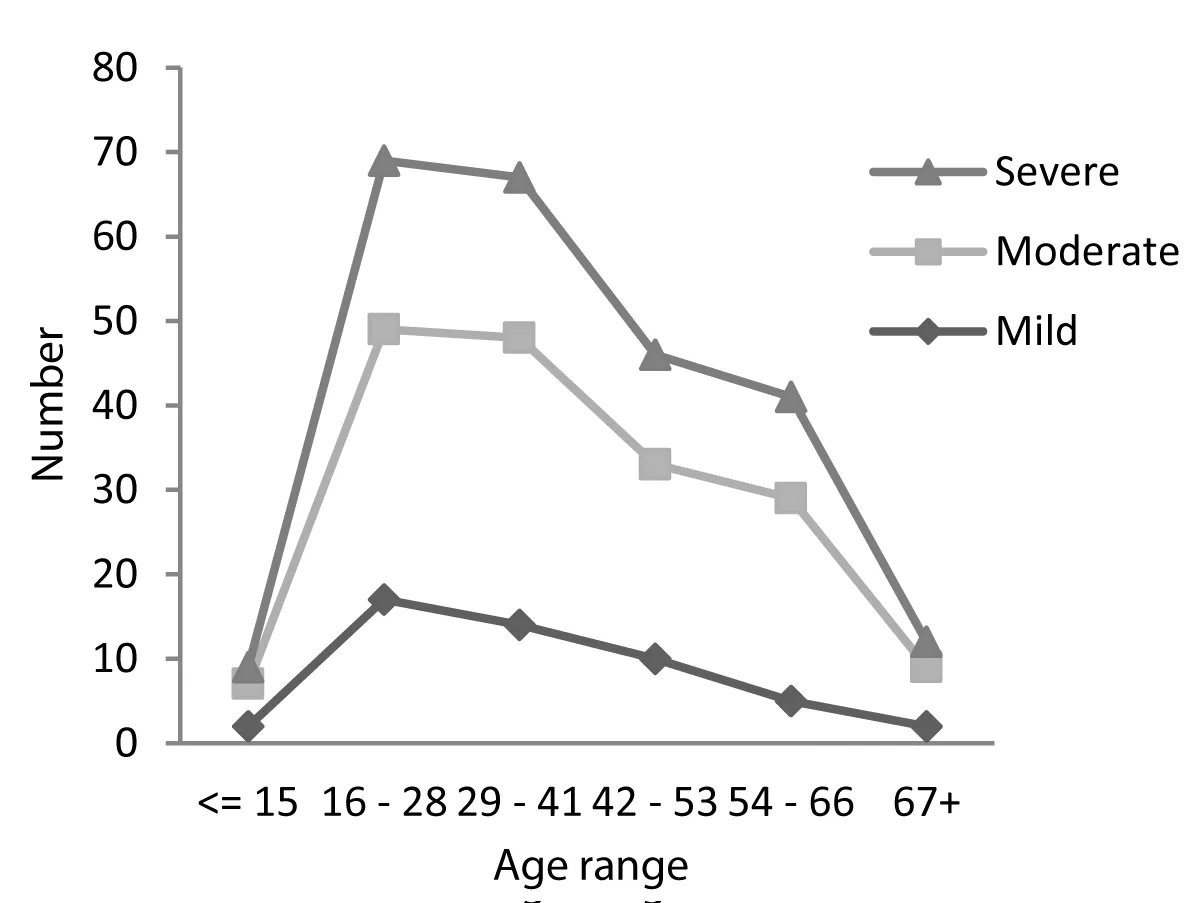
Figure 1: Relationship between age and degree of severity of the RHD.
Prevalence of MS and MR by gender
This study revealed beyond doubt that the severity level of prevalence of MS in the severity level, ‘severe’ was close to two-fold (4.3%) amongst females as compared to males. Curiously, the prevalence of MR amongst female patients was again higher than the males.
Empirical findings
This section presents the empirical findings from the models employed for explaining the factors associated with RHD and the likelihood of falling into three levels of severity. Foremost, the multivariate regression results illustrated in Table 1 showcased the factors associated with RHD. The predictors in the model included gender, age, frequency of visit, number of diagnostics, region, education, occupation, and employment status of RHD patients. Three models were run to capture the difference in fit improvement. The overall model fit was good since the F-statistic was significant (Prob > F = 0.0000).
| Table 1: Socio-Demographic and baseline characteristics of respondents by different categories of age: Number (%). | |||
| Variable/Age | < = 25 | 26 - 52 | 53+ |
| Gender | |||
| Female | 43(18.5%) | 83(35.8%) | 32(13.8%) |
| Frequency of visit | |||
| 1 Time | 48(71.6%) | 83(69.7%) | 6(13.0%) |
| 2 Times | 11(16.4%) | 22(18.5%) | 29(63.0%) |
| 3 Times | 8(11.9%) | 14(11.8%) | 11(23.9%) |
| RHD Subtype | |||
| MS | 15(14.7%) | 53(23.7%) | 21(16.7%) |
| MR | 47(46.1%) | 66(29.5%) | 31(24.6%) |
| AR | 26(25.5%) | 50(22.3%) | 15(11.9%) |
| AS | 1(1.0%) | 9(4.0%) | 9(7.1%) |
| AF | 2(2.0%) | 15(6.7%) | 18(14.3%) |
| CHF | 1(1.0%) | 2(0.9%) | 3(2.4%) |
| TR | 5(4.9%) | 21(9.4%) | 21(16.7%) |
| PHT | 1(1.0%) | 1(0.4%) | 1(0.8%) |
| CVA | 1(1.0%) | 6(2.7%) | 6(4.8%) |
| MVP | 3(2.9%) | 1(0.4%) | - |
| Severity level | |||
| Severe | 16(3.9%) | 26(21.8%) | 6(13.0%) |
| Moderate | 32(47.8%) | 59(49.6%) | 27(58.7%) |
| Mild | 19(28.4%) | 34(286%) | 13(28.3%) |
| No. of Diagnostics | |||
| 1 Disease | 38(56.7%) | 50(42.0%) | 3(6.5%) |
| 2 Diseases | 25(37.3%) | 38(31.9%) | 19(41.3%) |
| 3 Diseases | 3(4.5%) | 25(31.9%) | 17(37.0%) |
| 4 Diseases | 1(1.5%) | 5(4.2%) | 3(6.5%) |
| 5 Diseases | - | 1(0.8%) | 4(8.7%) |
| Education | |||
| Bachelors & above | - | 7(53.8%) | 6(46.2%) |
| Primary | 18(20.9%) | 48(55.8%) | 20(23.3%) |
| No Education | 15(20.0%) | 43(57.3%) | 17(22.7%) |
| Student | 100% | - | - |
| High School | 4(14.3%) | 21(75.0%) | 3(10.7%) |
| Occupation | |||
| Student | 30(100.0%) | - | - |
| Business | 14(21.9%) | 34(53.1%) | 16(25.0%) |
| Farmer | 23(16.7%) | 85(61.6%) | 30(21.7%) |
| Employment status | |||
| Student | 30 (100.0%) | - | - |
| Employed | 15(11.3%) | 101(75.9%) | 17(12.8%) |
| Unemployed | 22(31.9%) | 18(26.1%) | 29(42.0%) |
| Region | |||
| Western | 23(31.5%) | 34(46.6%) | 16(21.9%) |
| Central | 23(26.1%) | 47(53.4%) | 18(20.5%) |
| Eastern | 21(29.6%) | 38(53.5%) | 12(16.9%) |
| Note: MS: Mitral Stenosis; MR: Mitral Regurgitation; AS: Aortic Stenosis; AR: Aortic Regurgitation; TR: Tricuspid Regurgitation; PR: Pulmonary Regurgitation; AF: Atrial Fibrillation; CHF: Congestive Heart Failure | |||
The explanatory variables involved in this model explained about 89 percent variation in the RHD prevalence [6]. The degree of freedom is lost upon increasing the explanatory variables but at the same time, the error sum of squares is reduced. This composite effect is explained by adjusted R2, which in this study stands at 0.881 [7]. The RMSE value in this study ranged between 0.337 and 0.339 indicating that the model could relatively predict the data accurately. The adjusted R2 value of 0.75 also indicated that the model explained about 75% of the variability of the dependent variable around its mean [8]. The models were also checked for the presence of multicollinearity problems amongst the predictor variables. The tolerance statistics have surpassed the threshold value of 0.2 along with the Variance Inflation Factor (VIF) statistics value less than the cut-off point of 5 [9].
Table 2 presents the results of the multivariate regression. The dependent variable is the event of RHD amongst the 232 participants of this study. The predictors like age, frequency of visit, no. of diagnostics, and region are found to be statistically significant in explaining the RHD incidence according to Model 1. The coefficient of age is 0.01, suggesting that for every one year increase in the age of a patient is associated with the probability of an increase in the incidence of RHD by 0.01 on an average, holding other factors such as frequency of visit, no. of diagnostics, and region constant. On the other hand, the no. of diagnostics is positively associated with the incidence of RHD. For every increase of no. of diagnostic by one number, on average, there is a probability of increasing the incidence of RHD by 0.94, ceteris paribus. This study segregated patients into three regions (eastern, central, and western). The coefficient of central and eastern regions’ patients are positively related to the incidence of RHD. The results have revealed that those patients belonging to these two regions had probabilities of RHD event of 0.22 and 0.35 (p < 0.05) respectively, ceteris paribus. On the contrary, other factors such as education level, occupation, and employment status were statistically insignificant.
| Table 2: Results of the multivariate linear regression models. | |||
| Model | (1) | (2) | (3) |
| Variables | RHD | RHD | RHD |
| Female | -0.00832 | -0.0078 | -0.00828 |
| -0.049 | -0.049 | -0.05 | |
| Age | 0.00939** | 0.00788 | |
| -0.005 | -0.008 | ||
| Age2 | 3.82e-05* | 8.25E-06 | |
| 0.000 | 0.000 | ||
| No of diagnostics | 0.938*** | 0.936*** | 0.937*** |
| -0.026 | -0.026 | -0.027 | |
| Central | 0.224* | 0.0204 | 0.191 |
| -0.114 | -0.055 | -0.19 | |
| Eastern | 0.349* | 0.0115 | 0.295 |
| -0.18 | -0.059 | -0.307 | |
| Bachelors | -0.00272 | 0.0223 | -0.00258 |
| -0.135 | -0.133 | -0.138 | |
| Primary | -0.0288 | -0.0277 | -0.0302 |
| -0.068 | -0.068 | -0.072 | |
| Business | -0.12 | -0.107 | -0.12 |
| -0.112 | -0.111 | -0.113 | |
| Farmer | -0.0692 | -0.0551 | -0.0698 |
| -0.088 | -0.087 | -0.09 | |
| Employed | -0.0313 | -0.0157 | -0.0272 |
| -0.052 | -0.053 | -0.055 | |
| Constant | -0.305 | 0.140* | -0.233 |
| -0.227 | -0.083 | -0.406 | |
| Observations | 232 | 232 | 232 |
| R-squared | 0.885 | 0.885 | 0.885 |
| F | 170.00*** | 169.26*** | 153.88*** |
| RMSE | 0.341 | 0.342 | 0.342 |
| Standard errors in parentheses; ***p < 0.01, **p < 0.05, *p < 0.1 | |||
Quadratic relationship between age and RHD
According to the results of Model 2, there is evidence that age [2] (quadratic term) predicts the incidence of RHD (βAge2 = 0.004; p < 0.05). This implies that patients’ RHD event increases as the age keep increasing and reaches an optimal point and starts declining thereafter. This in other words implies that there is an optimal age that maximizes the incidence of RHD. Hence, based on the regression analysis, the optimal age of the patient that maximizes the incidence of RHD is computed as follows:
When the age is considered, the above calculation revealed that an increase of 2.62 years of age from the average maximizes patients’ RHD events.
Multinomial logistic regression results
This study employed a multinomial logistic regression model to explain the severity level as compared to the referent group (base outcome). The severity level, ‘moderate’ is automatically identified by Stata as the referent group (baseline comparison group). The model converged in 5 iterations (log-likelihood = -141.953). The Likelihood Ratio χ2 (26) = 192.83 with a p - value < 0.0000 indicates that the model, on the whole, fits significantly better than the null model [10]. Table 3 depicts the multinomial regression result for the mild and severe levels of RHD patients. Both coefficients and exponentiated coefficients or relative risk ratio (RRR) are expounded. Amongst the explanatory variables, only variables, ‘a number of diagnostics’ and ‘education level’ (bachelor) is significant at 95% and 90% respectively. The RRR against the number of diagnostics is less than one indicating less likelihood of falling into the level of ‘mild’ as compared to the referent group, ‘moderate.’ Similarly, patients with a higher level of education are more likely to fall into the level of ‘mild’ as compared to ‘moderate.’ Other variables like gender, region, occupation, and employment status have no impact on the mild level of RHD. In the severity level, ‘severe’, age is highly significant and as age keeps on increasing, it attains a certain level of maximum severity of RHD event and then eventually starts to decline (-0.002). The most daunting variable is the ‘frequency of visits to hospitals by RHD patients. Those patients who paid regular visits to hospitals were 184.14 times more likely to fall into the ‘severe’ level of RHD event as compared to the ‘moderate’ group.
| Table 3: Results of the multinomial logistic regression: Dependent variable by Mild/Severe RHD; Base outcome/referent group = moderate. | ||||||||
| Variable | Mild | Severe | ||||||
| Coefficient | RRR | 95% C.I for RRR | Coefficient | RRR | 95% C.I for RRR | |||
| Lower | Upper | Lower | Upper | |||||
| Female | 0.199 | 1.22 | 0.559 | 2.664 | 0.476 | 1.609 | 0.484 | 5.347 |
| (-0.398) | (-0.613) | |||||||
| Age | -0.0939 | 0.91 | 0.786 | 1.054. | 0.122 | 1.129 | 0.923 | 1.384 |
| (-0.0749) | (-0.103) | |||||||
| Age2 | 0.000176 | 1.00 | 0.999 | 1.001 | -0.00157*** | 0.998 | 0.997 | 0.999 |
| (-0.000382) | (-0.0005) | |||||||
| Frequency of visit | 0.611 | 1.843 | 0.556 | 6.111 | 5.216*** | 184.138 | 42.226 | 802.972 |
| (-0.612) | (-0.751) | |||||||
| No. of diagnostics | -0.502** | 0.605 | 0.379 | 0.965 | -0.341 | 0.711 | 0.365 | 1.386 |
| (-0.238) | (-0.341) | |||||||
| Western | 2.869 | 17.621 | 0.094 | 0.33 | -6.196 | 0.002 | 0 | 5.549 |
| (-2.669) | (-4.036) | |||||||
| Central | 1.024 | 2.783 | 0.281 | 27.572 | -2.689 | 0.068 | 0.003 | 1.681 |
| (-1.17) | (-1.637) | |||||||
| Bachelors | 2.017* | 7.513 | 0.884 | 63.855 | -2.991 | 0.05 | 0.001 | 2.894 |
| (-1.092) | (-2.068) | |||||||
| Primary | -0.00793 | 0.992 | 0.327 | 3.007 | -1.529 | 0.217 | 0.313 | 1.498 |
| (-0.566) | (-0.986) | |||||||
| High school | -0.133 | 0.875 | 0.249 | 3.067 | -0.182 | 0.833 | 0.142 | 4.897 |
| (-0.64) | (-0.903) | |||||||
| Business | -0.926 | 0.396 | 0.063 | 2.477 | 1.826 | 6.208 | 0.309 | 124.882 |
| (-0.935) | (-1.531) | |||||||
| Farmer | 0.0244 | 1.025 | 0.269 | 3.907 | 0.454 | 1.575 | 0.181 | 13.729 |
| (-0.683) | (-1.105) | |||||||
| Unemployed | -0.479 | 0.62 | 0.246 | 1.563 | -0.379 | 0.685 | 0.197 | 2.375 |
| (-0.472) | (-0.635) | |||||||
| Constant | 1.284*** | 3.61 | 0.278 | 46.799 | -7.849*** | 0.001 | 0.00 | 0.019 |
| (-1.307) | (-1.975) | |||||||
| Observations | 232 | 232 | ||||||
| Standard errors in parentheses; ***p < 0.01, **p < 0.05, *p < 0.1; C.I: Confidence Interval; RRR: Relative Risk Ratio | ||||||||
This study is the first of its kind in Bhutan to empirically present the results and can contribute to the existing bank of knowledge concerning CVD-related studies, particularly the RHD. The foremost finding is the prevalence of RHD amongst the young Bhutanese populace. About half (50%) of the RHD patients belonged to the age bracket of 16 - 36 years of age and the majority of them were females (68.1%).
Interestingly, more than half (59.5%) of the RHD patients were farmers from the central part of the country. A study by Paar, et al. [11] found that RHD prevailed amongst children and young adults (aged 5 to 15 years and 20 to 35 years) in León, Nicaragua. Their study revealed the overall prevalence of RHD in children as 48 in 1, 000. Globally, CVDs and in particular the RHD has been revealed as one of the leading causes of morbidity and mortality [12-13]. However, this study revealed that RHD patients were mostly (69.7%) first-time visitors seeking medical attention and a little more than half (50.9%) of them fell within the level, ‘moderate.’
Secondly, the empirical results revealed age as a crucial factor responsible for explaining the RHD amongst the participants. The analysis further revealed that as age keeps on increasing, the RHD event attains a maximum point and eventually declined to display a quadratic relationship between age and the RHD. Precisely, an increase of 2.62 years of age from the average maximized patients’ RHD event. One of the most glaring findings of this study pertains to the statistically significant relationship between the region and the RHD event. The RHD is quite prevalent in the central and eastern parts of Bhutan. This is a harbinger of the unknown causes related to the attributes of these two regions that merit a special case study. On the other hand, the multinomial logistic regression results revealed higher levels of education as an important factor for not making the patient fall into the category of ‘severe.’ Factors such as gender, occupation and status of employment were found insignificant.
Like any other study, this study is not devoid of limitations and, therefore, pigeonholes the sole limitation: data gathered pertains to only clinical examinations against echocardiographic screening. The inclusion of more relevant variables such as areas of residence and other associated factors based on existing literature and new cases is advised for future research. The study also directs the need for a case study in the central and eastern parts of Bhutan.
From this study, a few findings are worth noting and demand action from the Public Health Department (PHD) of the Ministry of Health (MoH). This study revealed that RHD is prevalent across all ages, especially amongst the younger population and mostly amongst female participants. When the severity of MS and MR by gender is considered, the prevalence of MS in the severity level, ‘severe’ is close to two-fold for female RHD patients. Curiously, the prevalence of MR amongst female patients is again higher than that of males.
Therefore, the public health department of the MoH needs to advocate public awareness, especially among the female populace of Bhutan on their susceptibility to RHD. The crucial factors are age, level of education, frequency of visits, number of diagnostics, and region patients belong. On the basis of these factors, the MoH has to further delve into the cause of RHD and screen the endemic areas (central and eastern regions) and as well detect more cohorts of the population at risk of RHD. Another daunting factor is the level of education. The MoH needs to find a way forwards to address this vulnerable cohort of the population in mitigating the risk of RHD and other CVDs.
Compliance with ethical standards
Disclaimer: The opinions expressed in this study are the author’s own and do not relate to JDWNRH or the Ministry of Health, Bhutan.
Ethical approval: This study simply used the data recorded by the co-author in his notebook over the past five years under his Department (Department of Cardiology) for which permission was sought from the Department.
The authors are grateful to the Department of Cardiology for encouraging this study using the data recorded by the co-author.
Key messages- The prevalence of MS in the severity level, ‘severe’ is close to two-fold for female RHD patients.
- The female populace needs to be made aware of their susceptibility to RHD.
- RHD is prevalent amongst the younger populace (16-41years old). An increase of 2.62 years of age from the average maximizes patients’ RHD events.
- Public health education or advocacy on RHD needs to be carried out vigorously amongst that populace with no education.
- A pocket study concerning RHD prevalence needs to be carried out in the central and eastern regions of the country.
- Reményi B, Wilson N, Steer A, Ferreira B, Kado J, Kumar K, Lawrenson J, Maguire G, Marijon E, Mirabel M, Mocumbi AO, Mota C, Paar J, Saxena A, Scheel J, Stirling J, Viali S, Balekundri VI, Wheaton G, Zühlke L, Carapetis J. World Heart Federation criteria for echocardiographic diagnosis of rheumatic heart disease--an evidence-based guideline. Nat Rev Cardiol. 2012 Feb 28;9(5):297-309. doi: 10.1038/nrcardio.2012.7. PMID: 22371105; PMCID: PMC5523449.
- Dorji Y, Tiensuwan M. Risk factors for cardiovascular diseases (CVDs) patients in Bhutan. InJournal of Physics. 2018;1039(1):012032. doi:10.1088/1742-6596/1039/1/012032.
- Marijon E, Mirabel M, Celermajer DS, Jouven X. Rheumatic heart disease. Lancet. 2012 Mar 10;379(9819):953-964. doi: 10.1016/S0140-6736(11)61171-9. PMID: 22405798.
- Auala T, Zavale BG, Mbakwem AÇ, Mocumbi AO. Acute Rheumatic Fever and Rheumatic Heart Disease: Highlighting the Role of Group A Streptococcus in the Global Burden of Cardiovascular Disease. Pathogens. 2022 Apr 21;11(5):496. doi: 10.3390/pathogens11050496. PMID: 35631018; PMCID: PMC9145486.
- McFadden D. Conditional logit analysis of qualitative choice behavior. In: Zarembka P, editor. Frontiers in econometrics. New York: Academic Press. 1974; 105-42. https://www.econbiz.de/Record/conditional-logit-analysis-of-qualitative-choice-behavior-mcfadden-daniel/10002395479. Accessed December 15, 2020.
- Akossou AYJ, Rodolphe Palm. "Impact of Data Structure on the Estimators R-square and Adjusted R-square in Linear Regression." Int. J. Math. Comput. 2013; 20: 84-93. https://www.researchgate.net/profile/Arcadius_Akossou2/publication/289526309_Impact_of_data_structure_on_the_estimators_R-square_and_adjusted_R-square_in_linear_regression/links/586a90ce08ae329d621114f2/Impact-of-data-structure-on-the-estimators-R-square-and-adjusted-R-square-in-linear-regression.pdf. Accessed December 21, 2020.
- Ranney GB, Thigpen CC. The sample coefficient of determination in simple linear regression. The American Statistician. 1981; 35(3):152-3. https://www.tandfonline.com/doi/abs/10.1080/00031305.1981.10479336. Accessed December 21, 2020.
- Saeedi, Mohammadhossein. Re: What's the acceptable value of Root Mean Square Error (RMSE), Sum of Squares due to error (SSE) and Adjusted R-square? 2020; https://www.researchgate.net/post/Whats-the-acceptable-value-of-Root-Mean-Square-Error-RMSE-Sum-of-Squares-due-to-error-SSE-and-Adjusted-R-square/5e9b97b5c6a89b649d5223cf/citation/download. Accessed December 15, 2020.
- O'brien RM. Quality & Quantity. A caution regarding rules of thumb for variance inflation factors. 2007; 41(5): 673-690. Doi:10.1007/s11135-006-9018-6.
- Long J. Scott, Jeremy Freese. Regression models for categorical dependent variables using Stata. Stata press. 2006; 7:327-335. .https://is.muni.cz/el/1423/podzim2010/VPL454/Regression_Models_For_Categorical_Dependent_Variables_USING_STATA.pdf. Accessed December 22, 2020.
- Paar JA, Berrios NM, Rose JD, Cáceres M, Peña R, Pérez W, Chen-Mok M, Jolles E, Dale JB. Prevalence of rheumatic heart disease in children and young adults in Nicaragua. Am J Cardiol. 2010 Jun 15;105(12):1809-14. doi: 10.1016/j.amjcard.2010.01.364. Epub 2010 Apr 27. PMID: 20538135; PMCID: PMC2895982.
- Lopez AD, Mathers CD, Ezzati M, Jamison DT, Murray CJ. Global and regional burden of disease and risk factors, 2001: systematic analysis of population health data. Lancet. 2006 May 27;367(9524):1747-57. doi: 10.1016/S0140-6736(06)68770-9. PMID: 16731270.
- Mensah GA, Roth GA, Fuster V. The Global Burden of Cardiovascular Diseases and Risk Factors: 2020 and Beyond. J Am Coll Cardiol. 2019 Nov 19;74(20):2529-2532. doi: 10.1016/j.jacc.2019.10.009. PMID: 31727292.