
More Information
Submitted: April 20, 2023 | Approved: May 15, 2023 | Published: May 16, 2023
How to cite this article: Tosto G, Passaniti G, Gibiino FA, Deste W, Indelicato A, et al. Myocardial fibrosis in aortic stenosis: comparison between clinical data, laboratory, echocardiography, and cardiac magnetic resonance. J Cardiol Cardiovasc Med. 2023; 8: 051-058.
DOI: 10.29328/journal.jccm.1001153
Copyright License: © 2023 Tosto G, et al. This is an open access article distributed under the Creative Commons Attribution License, which permits unrestricted use, distribution, and reproduction in any medium, provided the original work is properly cited.
Keywords: Aortic stenosis; Global longitudinal strain; Cardiac magnetic resonance; Fibrosis; Late gadolinium enhancement

Myocardial fibrosis in aortic stenosis: comparison between clinical data, laboratory, echocardiography, and cardiac magnetic resonance
Giuseppe Tosto, Giulia Passaniti, Fortunata Alessandra Gibiino, Wanda Deste*, Antonino Indelicato, Tito Torrisi, Giuseppe Bottaro, Maria Teresa Cannizzaro and Corrado Tamburino
CAST, AUO, Policlinico G Rodolico- San Marco, Catania, Italy
*Address for Correspondence: Wanda Deste, CAST, AUO, Policlinico G Rodolico- San Marco, Catania Italy, Email: [email protected]
Introduction: Patients with aortic stenosis often develop hypertrophy and fibrosis, regardless of symptoms. Cardiac Magnetic Resonance (CMR) represents the gold standard for the evaluation of fibrosis despite numerous limitations: cost, availability, atrial fibrillation, claustrophobia, kidney failure or inability to apnea.
Purpose: The aim is to validate the role of echocardiographic parameters, such as Global Longitudinal Strain (GLS), as early markers of fibrosis. Clinical and laboratory data, particularly B-type Natriuretic Peptide (BNP), were also analyzed.
Material and methods: In our study we recruited 33 patients with severe aortic stenosis, correlating echocardiographic values of GLS with the qualitative analysis of Late Gadolinium Enhancement (LGE) and the quantitative analysis of T1 mapping of CMR.
Results: 70% of patients with an alteration of GLS had LGE+. Univariate logistic regression shows that the factors associated with the presence of LGE on CMR are hypertension (p = 0.043), GLS (p = 0.032), and elevated BNP values (p = 0.021); for GLS, Odds Ratio (OR) is 5 so the chance of finding fibrosis on CMR increases 5 times in presence of an altered GLS. The multivariate analysis confirms the association with impaired GLS values (p = 0.033) and hypertension (p = 0.025), but not with elevated Pro-BNP values.
Conclusion: In patients with severe aortic stenosis, the association between GLS, LGE, and T1 mapping can help identify earlier those patients with structural changes caused by the disease, who could benefit from early intervention. It remains to be established how the presence of these alterations has a role in determining the intervention time and the outcome of these patients.
Aortic Stenosis (AS) is one of the most frequent valvulopathies, with an incidence that can reach 10% in patients older than 80 years old [1]. AS is characterized by progressive valve narrowing and subsequent remodeling of the left ventricle.
In AS, the myocardium of the Left Ventricle (LV) responds with a compensatory hypertrophy to warrant correct perfusion: The response of the LV to pressure overload imposed by the stenotic aortic valve is characterized by the addition in parallel of new myofibrils that lead to increased muscle fiber diameter and LV hypertrophy [2]. In the long term, myocytes are replaced by fibrotic tissue, the initial pathological sign of heart failure [3]. Usually, these pathological changes occur independently of patients ‘symptoms [4]. This condition leads to a higher risk of acute heart failure and sudden cardiac death, as the excessive deposition of the extracellular matrix lead to unfavorable cardiac remodelling [5,6]. The presence of fibrosis correlates with the worst prognosis after aortic valve replacement [7,8]. A precise evaluation of the severity of AS is crucial for patient management and risk stratification, and to evaluate symptoms legitimately. Echocardiography is the common method to assess AS severity. It relies on three parameters, the peak velocity (PVel), the mean pressure gradient (MPG), and the Aortic Valve Area (AVA) [9]. Furthermore, Cardiac Magnetic Resonance (CMR) represents the gold standard for the evaluation of fibrosis despite numerous limitations: cost, availability, atrial fibrillation, claustrophobia, kidney failure or inability to apnea [10]. Considering the preserved Ejection Fraction (EF), the echographic speckle-tracking technique showed a reduced longitudinal systolic function in symptomatic groups. This function, still preserved in asymptomatic patients, can guarantee better integrity of the LV itself and delay the probability of the symptomatology’s beginning. This agrees with the actual literature, where the prognostic value of LVGLS in patients with severe AS has been proven. Reduced value of deformation and speed longitudinal contraction shown in severe AS patients can be related to structural and functional myocardial alteration, caused by the expression of the high-weight myosin chain, the depositing amorphous and noncontracting mass and insulin-like growth factor-1 myocardial resistance. The progressive collagen deposit in subendocardial myocardial fibers can cause a reduced longitudinal strain rate [11-13].
The aim of this observational study is to describe the relationship between global longitudinal strain, left ventricular mass, BNP and myocardial fibrosis (detected with CMR) in a population of subjects with severe AS in order to find parameters related to ventricular dysfunction with a transthoracic echocardiogram. Patients with AS often develop hypertrophy and fibrosis and have a higher risk of acute heart failure and sudden death. However, we are not able yet to determine when hypertrophy becomes fibrosis, and in clinical practice, we do not have non-invasive instrumental methods capable of appropriately investigating the myocardial alterations. For this purpose, our study is aimed at validating the role of echocardiographic parameters as early markers of fibrosis.
In this study we selected a group of 33 patients with a mean age of 79 (± 5.815) years with numerous cardiovascular risk factors such as hypertension (76%), cigarette smoking (39%), diabetes mellitus (30%), obesity (18%), dyslipidemia (27%) and kidney failure (36%), suffering from severe aortic stenosis with AVA < 1 cm2, maximum gradient 73 (± 11.911) mmHg, mean gradient 42 (± 7.937) mmHg, Stroke Volume 75 (± 11.323) ml and maximum velocity of 4.3 (± 1.542) m/s. In addition, 39% of patients also had aortic insufficiency and 12% of these were classified as moderate. For what concerns the ventricle, left ventricular mass (LVM) 218.74 (± 56.995) g, indexed left ventricular mass (LVMi) 121.52 (± 23.364) g/m2 and GLS -15 (± 2.677) %. These patients underwent CMR with and without contrast and all the echographic values were compared with the corresponding CMRs and they resulted to be stackable. All investigations were conducted in the period between May 2019 and December 2021, with an interruption due to the COVID-19 pandemic. The exclusion criteria were: claustrophobia, pacemaker, atrial fibrillation, frequent ectopic beats and advanced kidney failure.
Echocardiogram
Our patients underwent a clinical and echocardiographic examination at the Cardiology Unit of the University of Catania. The transthoracic echocardiogram was performed with “Philips Epiq” with a two- and three-dimensional probe. The echocardiographic measurements were acquired in compliance with the guidelines published by the American Society of Echocardiography (ASE) and the European Association of Cardiovascular Imaging (EACVI). The degree of aortic stenosis was calculated by AVA (with the continuity equation), transvalvular gradients, and flow (using the Bernoulli equation) using the CW and PW Doppler [9]. The examinations were conducted with EKG monitoring, for the analysis of myocardial deformation.
GLS was calculated offline with images obtained from apical windows 4, 3, and 2 chambers. The software automatically calculated the degree of longitudinal deformation. The myocardial was divided into six zones (inferior, infero-septal, antero-septal, anterior, antero-lateral, infero-lateral). The average strain profile of the wall was analyzed for each area. From this analysis, we obtained the systolic peak of longitudinal strain (PSLS: Peak Systolic Longitudinal Strain) which is the maximum negative value of deformation during the ejection phase. The GLS was calculated from the averages of the values obtained by the individual myocardial walls for each window (Figure 1). 2D imaging was used for the calculation of the LVM. The formula for determining the mass was LVM = Area x Height. The area was calculated from the parasternal short-axis window (at the level of the papillary muscles) by subtracting the ventricular cavity from the area calculated at the epicardium level. The height was measured from the 4-chamber window as a base-apex distance. The ventricular mass was also indexed according to the formula LVMi = LVM/BSA. According to the guidelines, the upper reference value was 88 g/m2 in women and 102 g/m2 in men.
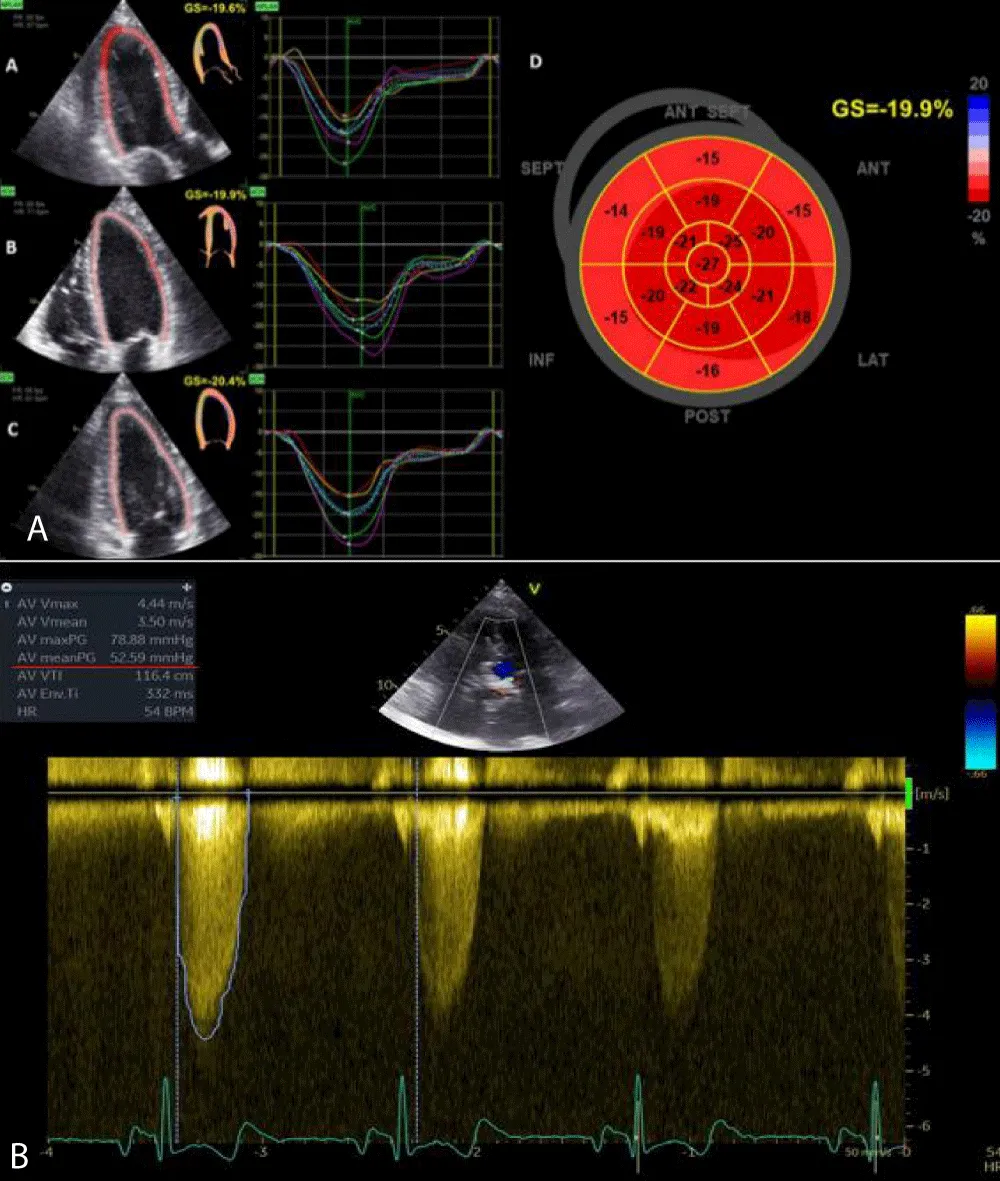
Figure 1: Bull-eyes of 17 segments, calculating GLS (A) and CW doppler through the aortic valve, which shows severe aortic stenosis (B).
BNP
BNP values were considered pathological > = 100 pg/mL.
Cardiac magnetic resonance
CMR was performed with the 1.5 Tesla, Ingenia Philips, machine at the Radiology Unit of the University of Catania. Electrodes for EKG recording and respiratory triggering were placed. Patients underwent a “survey” centering sequence along the three main axes: sagittal, coronal, and axial.
The first acquisition sequence was an axial anatomical SPIN-echo black blood sequence, useful for even a panoramic evaluation. Subsequently, starting from scout and axial BB the localization sequences along the cardiac axes are set, initially 3 (long axis 2 chambers, 4 chambers, and short axis) preparatory for the final images with a greater number of phases (30) and with slice-thickness of 8 mm. Cardiac imaging sequences are categorized into use for anatomic, functional and tissue characterization applications. The images were then acquired according to the following protocol:
- Centering sequence in the three sagittal, axial and longitudinal planes
- Axial T1 “black blood” spin echo sequence
- 3 Gradient echo sequences for the echocardiographic reference planes
- Cine Steady State Free Precession (SSFP) sequences, ideal for functional cardiac studies (Figure 2)
- Additional SSFP sequences in order to study the aortic valve plane (to study its morphological characteristics and to calculate the AVA) (Figures 3A and 3B)
- Native T1 mapping - myocardial longitudinal relaxation time (T1) mapping was set in short axis (end-diastole in 3 slices) with Modified Look-Locker Imaging that is a balanced steady-state free precession (Molli), acquired 10 minutes before contrast, in a mid-cavity. The MOLLI imaging was acquired in 11 images with a 360 x 360 mm field of view collected with a 192 x 183 matrix, 35° flip angle, 8 mm slice thickness, 1.1 ms echo time, 2.2 repetition time, and accelerator factor of 2. This is a technique for quantifying diffuse interstitial myocardial fibrosis.
- Contrast-enhanced T1 mapping was obtained 15 minutes after contrast injection, later acquisition than delay enhancement sequences; measurement of Extra-Cellular Volume (ECV) (a fraction of total myocardial volume) is obtained by native and postcontrast T1 mapping; ECV is correlated with collagen volume fraction and interstitial fibrosis as described in the introduction
- GE Inversion Recovery sequences were acquired 8 - 10 minutes after intravenous administration of 0.15 mg/dL of paramagnetic contrast medium (Gadovist) for myocardial tissue characterization.
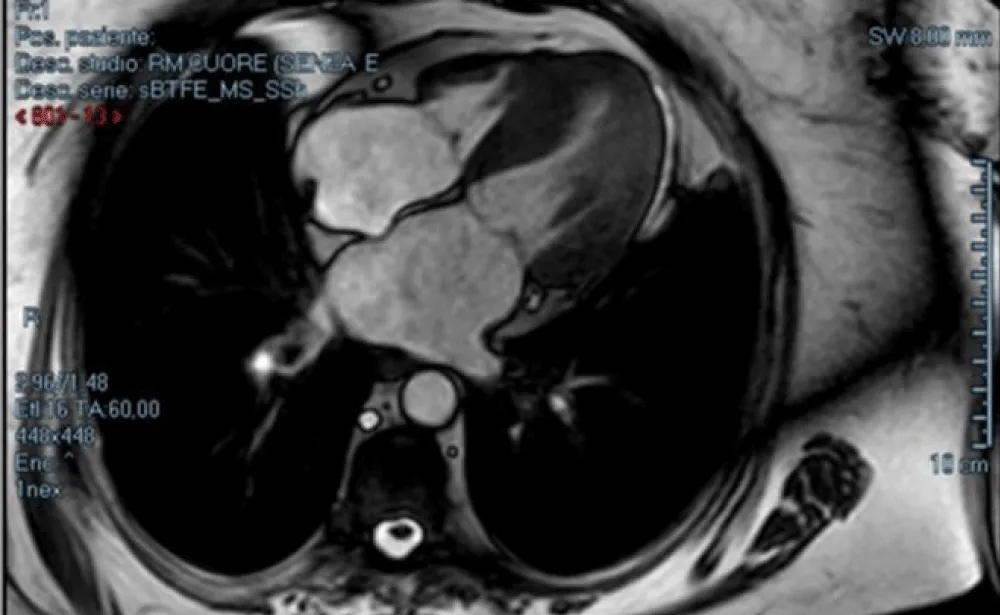
Figure 2: SSFP four chambers, in systolic phase.
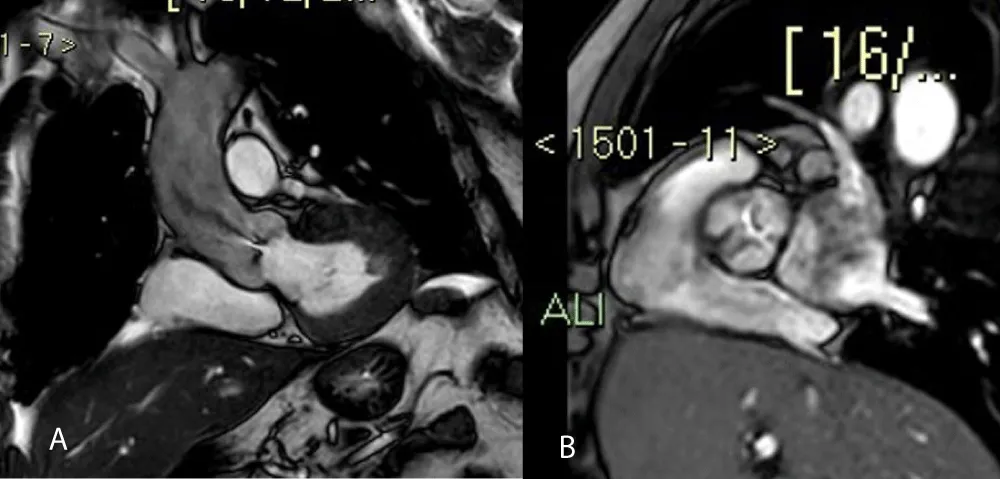
Figure 3: Coronal-axial valve aortic planes show a jet of anterograde turbulent flow (3A) and stenotic area (3B).
The images were then reprocessed with the Philips reconstruction console with the manual demarcation of the endocardial and epicardial margins of the left ventricle in diastole and systole. End diastolic and end systolic volumes, stroke volume, ejection fraction and LVM are calculated from the short-axis SSFP sequences. The functional data were then indexed for the body surface.
For the measurement of T1 and T2 relaxation times, a global approach is used, including the complete apical, midventricular, and basal SAX (short axis). Endocardial and epicardial contours of the LV are traced in all sequences, excluding fat, pericardium, and blood from analysis; an isolated ROI (region of interest) is inserted in the center of the blood in T1 mapping sequences (native and enhanced).
In the subsequent segmentation and results phases, the value by segment and average value for a section are extrapolated along 3 main plans acquired. In the re-elaboration of T1 in the segmentation phase, the hematocrit values are extrapolated from the laboratory parameters of the sampling carried out on the morning of the day of the survey. The addition of the hematocrit values is essential to extrapolate the ECV values, evaluated as both segment value and average value by section (Figure 4A and 4B).
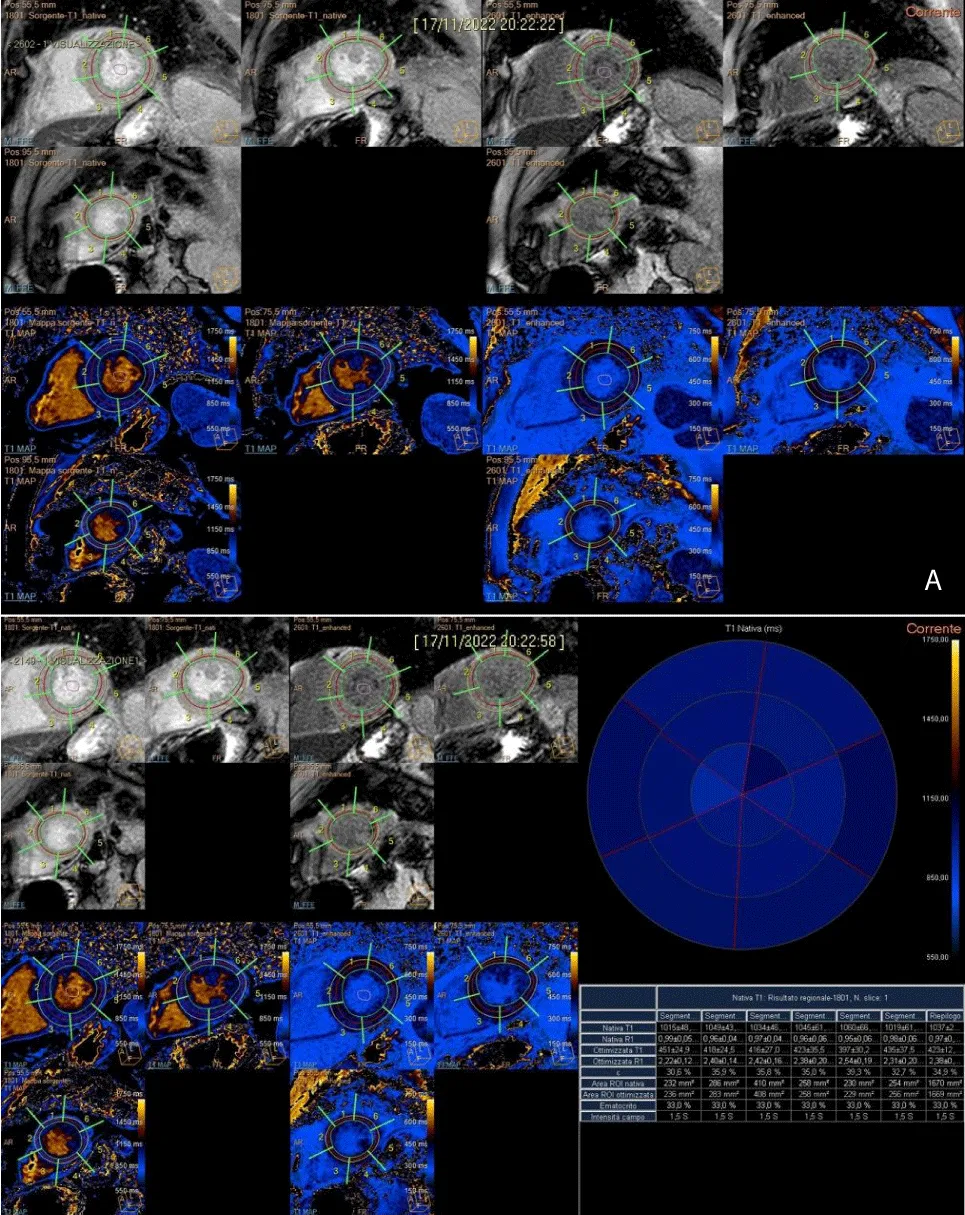
Figure 4: A). Post-processing T1 mapping, with the tracing of sub-endocardial and sub-epicardial borders, along three short-axial planes (basal, middle, and apical) and demarcation of intraluminal ROI. B). Semi-automatic quantitative analysis of T1 native, T1 enhanced with extrapolation of ECV.
Normal myocardium has a hypointense signal, unlike the altered one which shows a hyperintense signal. The presence of Late Gadolinium Enhancement (LGE) is characteristic of fibrotic or scarred areas. In patients with AS, the LGE distribution is typically distributed in the infero-lateral wall of the myocardium, especially in the basal and middle segments (Figure 5).
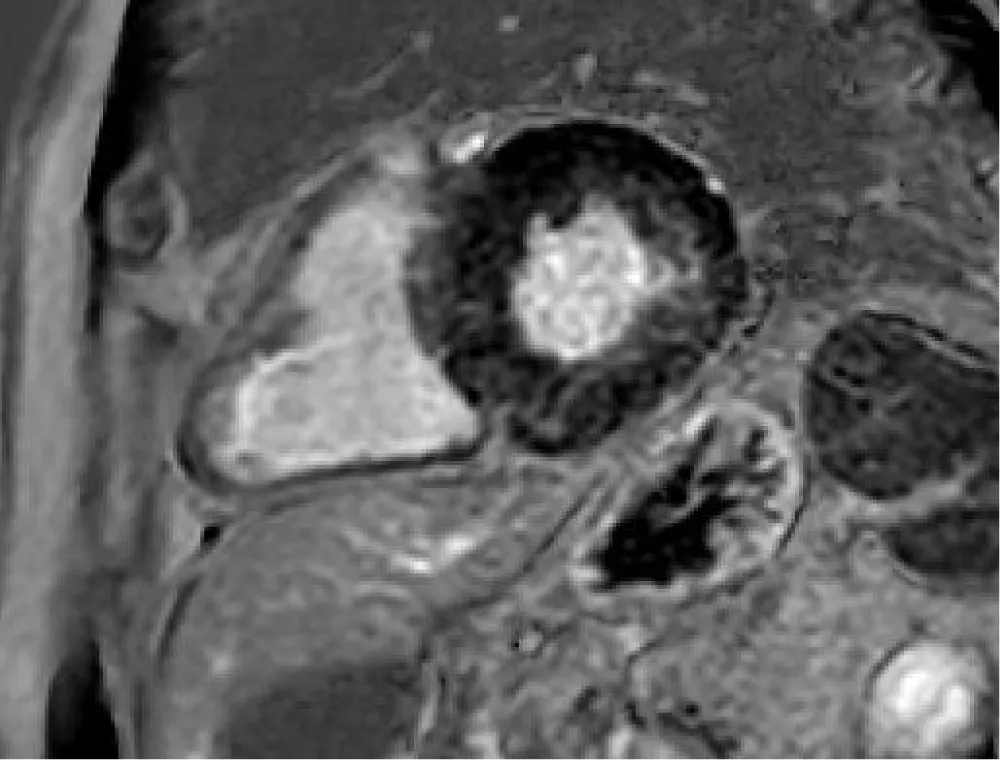
Figure 5: LGE sequences show mild hyperintensity signal in the mesocardial wall, especially along the inferolateral segment as fibrotic disarray.
For the quantitative analysis, the enhancement was divided into:
- Transmural: parietal involvement> 50%
- Non-transmural: parietal involvement <50%
Statistical analysis
Continuous variables were presented as median and percentiles, and categorical variables as numbers and percentiles. The categorical variables were analyzed with the chi-square test and the continuous variables with the T Student test. In both cases, the “p” is considered insignificant if > 0.05, relevant if < 0.05, and very relevant if < 0.001. A univariate and multivariate analysis was performed.
There were 33 patients (14 females, 19 male) with severe AS enrolled. These patients had multiple cardiovascular risk factors, including hypertension, diabetes mellitus, obesity, cigarette smoking, renal failure, and dyslipidemia. From the remote and near-pathological anamnestic history, it emerged that 61% had dyspnea, 9% had angina and 6% had syncope. 24% of the patients were totally asymptomatic. Furthermore, 57% had NYHA functional class > = 2 (15% had NYHA 3). From the statistical analysis, it emerged that 70% of patients with pathological GLS values have fibrosis and LGE on the CMR of the heart. Univariate logistic regression showed that the factors associated with the presence of LGE on CMR are hypertension (p = 0.043), GLS (p = 0.032), and elevated BNP values (p = 0.021); for GLS, the odds ratio (OR) is 5 so the possibility of having fibrosis on CMR increases by 5 times in the presence of an altered GLS. The multivariate analysis confirmed the association with altered GLS values (p = 0.033) and hypertension (p = 0.025), but not with high BNP values (Table 1). 92% of patients with pathological LGE values have micro-fibrosis and an altered T1 mapping on Cardiac Magnetic Resonance. Univariate logistic regression showed that the factors associated with the presence of altered T1 mapping on CMR are the same analyzed for LGE, with similar values: hypertension (p = 0.029), GLS (p = 0.016), and elevated Pro-BNP values (p = 0.015) (Table 2).
| Table 1: Comparison of Variable between LGE+ and LGE- Groups. | |||
| Variable | LGE– (n = 10) | LGE+ (n = 23) | p value |
| Age | 79,1 (± 2,767) | 79,3 (± 6,785) | 0,928 |
| LVM | 189,50 (± 39,901) | 218,74 (± 56,995) | 0,152 |
| EF | 64,50% (± 4,222) | 58,91% (± 7,977) | 0,046 |
| GLS % | -18,100 (1,390) | -15,774 (± 2,677) | 0,015 |
| Pro-BNP | 316,20 (± 202,600) | 520,57 (± 204,033) | 0,013 |
| Hypertension | 5 (50%) | 20 (87%) | 0,023 |
| Gmed | 39,10 (± 9,666) | 41,91 (± 1,937) | 0,388 |
| Table 2: T1 Mapping statistical significance. | |||
| Variable | T1 Mapping – (n = 4) | T1 Mapping + (n = 29) | p value |
| Age | 78,4 | 79,9 | 0.915 |
| Hypertension | 3 | 25 | 0.029 |
| BNP | 389,18 | 454,12 | 0.015 |
| EF% | 60,2% | 57,1% | 0.05 |
| LVM | 195,1 | 221,3 | 0.21 |
| Gmed | 38,1 | 42,8 | 0.329 |
| GLS% | -18,6 | -15,5 | 0.016 |
Severe AS is a disease with a progressive increase in prevalence, due to the increasing life expectancy. The guidelines are able to help the clinician in the therapeutic decision for the treatment of symptomatic patients but are less clear in the indications concerning asymptomatic patients. Ventricles in AS are able to “tolerate” the alterations caused by disease for many years and contractile function is reduced only in the most advanced stages of the disease. For this reason, in recent years research has been focused on early indicators of structural alterations. Among these, GLS has been extensively studied in aortic stenosis as well as in many other diseases, as an early indicator of subclinical systolic dysfunction [14-17]. Cardiac Magnetic Resonance is certainly more sensitive in estimating cardiac mass and detecting myocardial structural alterations but its large-scale use is limited by the availability and cost of the method [18].
In this study, we looked for factors potentially associated with the development of fibrosis and LGE on CMR and, in particular, for an association between altered GLS values, myocardial mass, and the development of fibrosis. Some studies have already tried to find an association between GLS and fibrosis, concluding that GLS correlates well with the presence of myocardial fibrosis, although its use is limited by the possible overlap of other pathological conditions (for example ischemic heart disease) as well as they can cause alterations of the GLS [19]. In addition, the fibrosis detected with LGE was also related to the presence of arterial hypertension and altered Pro-BNP values, although the latter association was not detected in the multivariate analysis; this could be related to the small size of the sample examined and to the fact that the examination was performed in different laboratories; moreover, for some, the values of the BNP were available, for others the values of the NT-pro-BNP. Although hypertension was associated with the risk of developing fibrosis on CMR, this could be due to the high prevalence (76%) in the sample examined. On the other hand, no alterations related to the increase in myocardial mass were detected, although this may be due to the high inter-individual variability of the echocardiographic measurements performed. T1 mapping is a very important value, especially for the detection of micro-fibrosis [20,21], and we found that in 92% of patients with an altered T1 mapping, there is a correlation with the LGE. This implies that micro-fibrosis (T1 mapping +) is already present in patients who also have macro-fibrosis (LGE +). Calvin, et al. and Lee, et al. have shown that early intervention with valve replacement surgery in patients with micro-fibrosis can lead to better outcomes [22,23]. Therefore, intervening at the micro-fibrosis stage, in patients with an altered T1 mapping can prevent irreversible remodeling that leads to an increase in mortality [24,25]. Therefore, T1 mapping allows identifying the correct therapeutic pathway for the patient.
Limitations of the study
The sample examined is small, due to the period of interruption linked to the COVID-19 pandemic. Another limitation lies in the fact that a comparison was not made with subjects with other pathological conditions which could also cause alterations in the GLS. Furthermore, the presence of these pathological conditions cannot be completely excluded given the high prevalence in the age group studied of other pathologies that may have led to a reduction in GLS. Finally, the limited period of follow-up observation did not allow to clarify the correlation between the outcomes of the disease and its possible treatment.
In conclusion, our study found an association between GLS and CMR in the evaluation of myocardial fibrosis. Despite the small sample size, this could allow us to identify earlier, in patients suffering from severe AS, those with structural alterations determined by the disease who could benefit from early intervention. It remains to be established, through a longer follow-up, how the presence of structural alterations can influence the outcome of patients suffering from aortic stenosis.
Furthermore, being able to detect micro-fibrosis with strain in echocardiography could guarantee the establishment of closer follow-ups in patients in whom left ventricular remodeling is suspected in order to refer them earlier to valve replacement surgery, ensuring a better early treatment for all patients, even those who cannot undergo Cardiac Magnetic Resonance.
The future perspectives regarding the treatment of AS have the purpose of allowing an early treatment, especially with regard to the onset of myocardial fibrosis in such a way as to guarantee an early recovery of cardiac function, prevent the risk of death, and therefore, guarantee better patient outcomes.
- Otto CM, Prendergast B. Aortic-valve stenosis--from patients at risk to severe valve obstruction. N Engl J Med. 2014 Aug 21;371(8):744-56. doi: 10.1056/NEJMra1313875. PMID: 25140960.
- Delgado V, Bax JJ. Will Cardiac Magnetic Resonance Change the Management of Severe Aortic Stenosis Patients? JACC Cardiovasc Imaging. 2018 Jul;11(7):984-986. doi: 10.1016/j.jcmg.2017.11.039. PMID: 29976304.
- Unverferth DV, Baker PB, Swift SE, Chaffee R, Fetters JK, Uretsky BF, Thompson ME, Leier CV. Extent of myocardial fibrosis and cellular hypertrophy in dilated cardiomyopathy. Am J Cardiol. 1986 Apr 1;57(10):816-20. doi: 10.1016/0002-9149(86)90620-x. PMID: 2938462.
- Chin CWL, Everett RJ, Kwiecinski J, Vesey AT, Yeung E, Esson G, Jenkins W, Koo M, Mirsadraee S, White AC, Japp AG, Prasad SK, Semple S, Newby DE, Dweck MR. Myocardial Fibrosis and Cardiac Decompensation in Aortic Stenosis. JACC Cardiovasc Imaging. 2017 Nov;10(11):1320-1333. doi: 10.1016/j.jcmg.2016.10.007. Epub 2016 Dec 21. PMID: 28017384; PMCID: PMC5683736.
- Anderson KR, Sutton MG, Lie JT. Histopathological types of cardiac fibrosis in myocardial disease. J Pathol. 1979 Jun;128(2):79-85. doi: 10.1002/path.1711280205. PMID: 572867.
- Hein S, Arnon E, Kostin S, Schönburg M, Elsässer A, Polyakova V, Bauer EP, Klövekorn WP, Schaper J. Progression from compensated hypertrophy to failure in the pressure-overloaded human heart: structural deterioration and compensatory mechanisms. Circulation. 2003 Feb 25;107(7):984-91. doi: 10.1161/01.cir.0000051865.66123.b7. PMID: 12600911.
- Chin CWL, Everett RJ, Kwiecinski J, Vesey AT, Yeung E, Esson G, Jenkins W, Koo M, Mirsadraee S, White AC, Japp AG, Prasad SK, Semple S, Newby DE, Dweck MR. Myocardial Fibrosis and Cardiac Decompensation in Aortic Stenosis. JACC Cardiovasc Imaging. 2017 Nov;10(11):1320-1333. doi: 10.1016/j.jcmg.2016.10.007. Epub 2016 Dec 21. PMID: 28017384; PMCID: PMC5683736.
- Dweck MR, Joshi S, Murigu T, Alpendurada F, Jabbour A, Melina G, Banya W, Gulati A, Roussin I, Raza S, Prasad NA, Wage R, Quarto C, Angeloni E, Refice S, Sheppard M, Cook SA, Kilner PJ, Pennell DJ, Newby DE, Mohiaddin RH, Pepper J, Prasad SK. Midwall fibrosis is an independent predictor of mortality in patients with aortic stenosis. J Am Coll Cardiol. 2011 Sep 13;58(12):1271-9. doi: 10.1016/j.jacc.2011.03.064. PMID: 21903062.
- Baumgartner H Chair, Hung J Co-Chair, Bermejo J, Chambers JB, Edvardsen T, Goldstein S, Lancellotti P, LeFevre M, Miller F Jr, Otto CM. Recommendations on the echocardiographic assessment of aortic valve stenosis: a focused update from the European Association of Cardiovascular Imaging and the American Society of Echocardiography. Eur Heart J Cardiovasc Imaging. 2017 Mar 1;18(3):254-275. doi: 10.1093/ehjci/jew335. PMID: 28363204.
- Barone-Rochette G, Piérard S, De Meester de Ravenstein C, Seldrum S, Melchior J, Maes F, Pouleur AC, Vancraeynest D, Pasquet A, Vanoverschelde JL, Gerber BL. Prognostic significance of LGE by CMR in aortic stenosis patients undergoing valve replacement. J Am Coll Cardiol. 2014 Jul 15;64(2):144-54. doi: 10.1016/j.jacc.2014.02.612. PMID: 25011718.
- Bottaro G, Zappulla P, Deste W, Famà F, Agnello F, Trovato D, Indelicato A, Barbanti M, Sgroi C, Monte IP, Tamburino C. Severe Aortic Valve Stenosis: Symptoms, Biochemical Markers, and Global Longitudinal Strain. J Cardiovasc Echogr. 2020 Jul-Sep;30(3):154-161. doi: 10.4103/jcecho.jcecho_13_20. Epub 2020 Nov 9. PMID: 33447506; PMCID: PMC7799072.
- Park SJ, Cho SW, Kim SM, Ahn J, Carriere K, Jeong DS, Lee SC, Park SW, Choe YH, Park PW, Oh JK. Assessment of Myocardial Fibrosis Using Multimodality Imaging in Severe Aortic Stenosis: Comparison With Histologic Fibrosis. JACC Cardiovasc Imaging. 2019 Jan;12(1):109-119. doi: 10.1016/j.jcmg.2018.05.028. Epub 2018 Nov 15. PMID: 30448148.
- Le TT, Huang W, Singh GK, Toh DF, Ewe SH, Tang HC, Loo G, Bryant JA, Ang B, Tay EL, Soo WM, Yip JW, Oon YY, Gong L, Lunaria JB, Yong QW, Lee EM, Yeo PSD, Chai SC, Goh PP, Ling LF, Ong HY, Richards AM, Delgado V, Bax JJ, Ding ZP, Ling LH, Chin CWL. Echocardiographic Global Longitudinal Strain Is Associated With Myocardial Fibrosis and Predicts Outcomes in Aortic Stenosis. Front Cardiovasc Med. 2021 Nov 10;8:750016. doi: 10.3389/fcvm.2021.750016. PMID: 34859068; PMCID: PMC8631398.
- Klaeboe LG, Haland TF, Leren IS, Ter Bekke RMA, Brekke PH, Røsjø H, Omland T, Gullestad L, Aakhus S, Haugaa KH, Edvardsen T. Prognostic Value of Left Ventricular Deformation Parameters in Patients with Severe Aortic Stenosis: A Pilot Study of the Usefulness of Strain Echocardiography. J Am Soc Echocardiogr. 2017 Aug;30(8):727-735.e1. doi: 10.1016/j.echo.2017.04.009. Epub 2017 Jun 7. PMID: 28599826.
- Kearney LG, Lu K, Ord M, Patel SK, Profitis K, Matalanis G, Burrell LM, Srivastava PM. Global longitudinal strain is a strong independent predictor of all-cause mortality in patients with aortic stenosis. Eur Heart J Cardiovasc Imaging. 2012 Oct;13(10):827-33. doi: 10.1093/ehjci/jes115. Epub 2012 Jun 26. PMID: 22736713.
- Ng AC, Delgado V, Bertini M, Antoni ML, van Bommel RJ, van Rijnsoever EP, van der Kley F, Ewe SH, Witkowski T, Auger D, Nucifora G, Schuijf JD, Poldermans D, Leung DY, Schalij MJ, Bax JJ. Alterations in multidirectional myocardial functions in patients with aortic stenosis and preserved ejection fraction: a two-dimensional speckle tracking analysis. Eur Heart J. 2011 Jun;32(12):1542-50. doi: 10.1093/eurheartj/ehr084. Epub 2011 Mar 29. PMID: 21447510.
- Kusunose K, Goodman A, Parikh R, Barr T, Agarwal S, Popovic ZB, Grimm RA, Griffin BP, Desai MY. Incremental prognostic value of left ventricular global longitudinal strain in patients with aortic stenosis and preserved ejection fraction. Circ Cardiovasc Imaging. 2014 Nov;7(6):938-45. doi: 10.1161/CIRCIMAGING.114.002041. Epub 2014 Oct 15. PMID: 25320287.
- Vassiliou VS, Perperoglou A, Raphael CE, Joshi S, Malley T, Everett R, Halliday B, Pennell DJ, Dweck MR, Prasad SK. Midwall Fibrosis and 5-Year Outcome in Moderate and Severe Aortic Stenosis. J Am Coll Cardiol. 2017 Apr 4;69(13):1755-1756. doi: 10.1016/j.jacc.2017.01.034. PMID: 28359524.
- Spath NB, Gomez M, Everett RJ, Semple S, Chin CWL, White AC, Japp AG, Newby DE, Dweck MR. Global Longitudinal Strain Analysis Using Cardiac MRI in Aortic Stenosis: Comparison with Left Ventricular Remodeling, Myocardial Fibrosis, and 2-year Clinical Outcomes. Radiol Cardiothorac Imaging. 2019 Oct 31;1(4):e190027. doi: 10.1148/ryct.2019190027. PMID: 33778518; PMCID: PMC7977929.
- Bull S, White SK, Piechnik SK, Flett AS, Ferreira VM, Loudon M, Francis JM, Karamitsos TD, Prendergast BD, Robson MD, Neubauer S, Moon JC, Myerson SG. Human non-contrast T1 values and correlation with histology in diffuse fibrosis. Heart. 2013 Jul;99(13):932-7. doi: 10.1136/heartjnl-2012-303052. Epub 2013 Jan 24. PMID: 23349348; PMCID: PMC3686317.
- Kockova R, Kacer P, Pirk J, Maly J, Sukupova L, Sikula V, Kotrc M, Barciakova L, Honsova E, Maly M, Kautzner J, Sedmera D, Penicka M. Native T1 Relaxation Time and Extracellular Volume Fraction as Accurate Markers of Diffuse Myocardial Fibrosis in Heart Valve Disease - Comparison With Targeted Left Ventricular Myocardial Biopsy. Circ J. 2016 Apr 25;80(5):1202-9. doi: 10.1253/circj.CJ-15-1309. Epub 2016 Mar 17. PMID: 26984717.
- Chin CWL, Everett RJ, Kwiecinski J, Vesey AT, Yeung E, Esson G, Jenkins W, Koo M, Mirsadraee S, White AC, Japp AG, Prasad SK, Semple S, Newby DE, Dweck MR. Myocardial Fibrosis and Cardiac Decompensation in Aortic Stenosis. JACC Cardiovasc Imaging. 2017 Nov;10(11):1320-1333. doi: 10.1016/j.jcmg.2016.10.007. Epub 2016 Dec 21. PMID: 28017384; PMCID: PMC5683736.
- Lee H, Park JB, Yoon YE, Park EA, Kim HK, Lee W, Kim YJ, Cho GY, Sohn DW, Greiser A, Lee SP. Noncontrast Myocardial T1 Mapping by Cardiac Magnetic Resonance Predicts Outcome in Patients With Aortic Stenosis. JACC Cardiovasc Imaging. 2018 Jul;11(7):974-983. doi: 10.1016/j.jcmg.2017.09.005. Epub 2017 Nov 15. PMID: 29153562.
- Castrichini M, Vitrella G, De Luca A, Altinier A, Korcova R, Pagura L, Radesich C, Sinagra G. Clinical impact of myocardial fibrosis in severe aortic stenosis. Eur Heart J Suppl. 2021 Oct 8;23(Suppl E):E147-E150. doi: 10.1093/eurheartj/suab120. PMID: 34650375; PMCID: PMC8503407.
- Bing R, Cavalcante JL, Everett RJ, Clavel MA, Newby DE, Dweck MR. Imaging and Impact of Myocardial Fibrosis in Aortic Stenosis. JACC Cardiovasc Imaging. 2019 Feb;12(2):283-296. doi: 10.1016/j.jcmg.2018.11.026. PMID: 30732723; PMCID: PMC6361867.