
More Information
Submitted: October 14, 2023 | Approved: October 23, 2023 | Published: October 24, 2023
How to cite this article: Bah K, Jallow AW, Ns Bah A, Touray M, et al. Developing a Machine Learning Algorithm for Improved Management of Congestive Heart Failure Patients in the Emergency Department. J Cardiol Cardiovasc Med. 2023; 8: 142-151.
DOI: 10.29328/journal.jccm.1001167
Copyright License: © 2023 Bah K, et al. This is an open access article distributed under the Creative Commons Attribution License, which permits unrestricted use, distribution, and reproduction in any medium, provided the original work is properly cited.
Keywords: Congestive heart failure; Triage; Prognostication; Prediction; Resource allocation; Machine learning

Developing a Machine Learning Algorithm for Improved Management of Congestive Heart Failure Patients in the Emergency Department
Karamo Bah1*, Amadou Wurry Jallow2, Adama Ns Bah3 and Musa Touray4
1Graduate Institute of Biomedical Informatics, College of Medical Science and Technology, Taipei Medical University, Taipei 11031, Taiwan
2Department of Medical Laboratory Science and Biotechnology, Taipei Medical University, Taipei 11031, Taiwan
3Graduate Institute of Biomedical Informatics, College of Medical Science and Technology, Taipei Medical University, Taipei 11031, Taiwan
4University of The Gambia, School of Medicine and Allied Health Sciences, MDI Road, Kanifing P.O. Box 3530, Serrekunda, Gambia, West Africa
*Address for Correspondence: Karamo Bah, Graduate Institute of Biomedical Informatics, College of Medical Science and Technology, Taipei Medical University, Taipei 11031, Taiwan, Email: [email protected]
Background and aim: Congestive heart failure is a prevalent and serious condition that poses significant challenges in the emergency department setting. Prompt and accurate management of congestive heart failure patients is crucial for improving outcomes and optimizing resource utilization. This study aims to address these challenges by developing a machine learning algorithm and comparing it to a traditional logistic regression model that can assist in the triage, resource allocation, and long-term prognostication of congestive heart failure patients.
Methods: In this investigation, we used the MIMIC-III database, a publicly accessible resource containing patient data from ICU settings. Traditional logistic regression, along with the robust XGBoost and random forest algorithms, was harnessed to construct predictive models. These models were built using a range of pretreatment clinical variables. To pinpoint the most pertinent features, we carried out a univariate analysis. Ensuring robust performance and broad applicability, we adopted a nested cross-validation approach. This method enhances the precision and validation of our models by implementing multiple cross-validation iterations.
Results: The performance of machine learning algorithms was assessed using the area under the receiver operating characteristic curve (AUC). Notably, the random forest algorithm, despite having lower performance among the machine learning models still demonstrated significantly higher AUC than traditional logistic regression. The AUC for the XGBoost was 0.99, random forest 0.98, while traditional logistic regression was 0.57. The most important pretreatment variables associated with congestive heart failure include total bilirubin, creatine kinase, international normalized ratio (INR), sodium, age, creatinine, potassium, gender, alkaline phosphatase, and platelets.
Conclusion: Machine learning techniques utilizing multiple pretreatment clinical variables outperform traditional logistic regression in aiding the triage, resource allocation, and long-term prognostication of congestive heart failure patients in the intensive care unit setting using MIMIC III data.
Heart failure (HF) is a complex and life-threatening syndrome associated with significant morbidity, mortality, and high costs. According to the Global Health Data Exchange registry, the current worldwide prevalence of congestive heart failure (CHF) stands at around 64.34 million cases [1]. However, while the incidence rate of heart failure seems to have stabilized, the prevalence continues to rise as more patients receive therapy. Unfortunately, this increase in prevalence has not led to an improvement in the quality of life for patients with heart failure or a reduction in hospitalizations [2]. Heart failure HF is a common cause of hospitalization, particularly among older patients, and presents challenges in diagnosis, management, organization of health services, and risk prediction [3,4]. It is also one of the most costly healthcare conditions to manage in high-income countries. The use of registries and institutional databases to aggregate large amounts of data from diagnostic tests, invasive procedures, and therapies can provide valuable insights into healthcare utilization, quality and cost of care, and disease progression. However, the size, complexity, and dynamic nature of these “big data” can present challenges for traditional analytical methods to effectively analyze and interpret the data [4,5].
Machine learning (ML) is a branch of artificial intelligence that allows machines to learn and acquire knowledge from raw data without explicit programming. It utilizes computer algorithms to extract patterns and make predictions or classifications. Unlike traditional statistical methods, ML can handle large and complex datasets with a low signal-to-noise ratio. ML algorithms require fewer assumptions and can uncover novel relationships in the data [4,6,7]. ML can address the challenges in delivering the right care to the right patient in HF. Diagnostic uncertainty, treatment variation, and safety response can be attributed to the suboptimal generalizability of clinical trial results, complexity in risk stratification, and limited integration of information at the point of care [8].
Machine Learning offers important advantages over traditional human-derived models in bridging these gaps in HF. It can improve generalizability by leveraging large and diverse datasets, enabling the development of predictive models that encompass a broader range of patients and clinical scenarios. ML algorithms can analyze and extract patterns from extensive datasets, allowing for more accurate risk stratification and personalized treatment recommendations in HF. By considering multiple variables and interactions simultaneously, ML models can identify novel relationships and factors that impact patient outcomes [9]. Machine learning has the potential to enhance the integration of information at the point of care by providing real-time decision support and incorporating patient-specific data into treatment plans. Furthermore, ML can address the limitations of traditional clinical trials in the context of heart failure (HF). Clinical trials typically impose stringent inclusion and exclusion criteria, leading to limited generalizability in real-world populations. By utilizing data from observational registries, ML can compare patient characteristics and outcomes between trial participants and real-world patients, thereby providing insights into the external validity of trial results. ML also enables the identification of patients who would have met the eligibility criteria for trial enrollment based on registry data, facilitating a better understanding of the applicability of trial findings to broader patient populations [3,8,10,11]. The goal of this study is to develop a machine learning algorithm that can assist in the triage, resource allocation, and long-term prognostication of congestive heart failure patients in the intensive care unit (ICU) using pretreatment features and to compare our method with traditional logistic regression.
Patient population
This study utilized a retrospective cohort design. The data used in this study was obtained from an openly available database MIMIC III, specifically from the Beth Israel Deaconess Medical Center in Boston, USA [12]. The database contained de-identified information on a total of 46,520 patients and 58,976 admissions. These numbers show that the admissions are more than the total number of patients because some patients have more than one admission. Various types of data were collected, including demographics, admission notes, International Classification of Diseases-9th revision (ICD-9) diagnoses, laboratory tests, medications, procedures, fluid balance, discharge summaries, vital sign measurements, radiology reports, and survival data. To establish a focused cohort, certain exclusion criteria were applied. Patients with diagnoses other than congestive heart failure (CHF), patients who were not admitted through the emergency department, and patients who did not meet the specific criteria were excluded. Ultimately, a total of 9,685 patients who were admitted through the emergency department were included in the study. Among them, 666 patients (7%) were diagnosed with CHF, while 9,019 patients (93%) did not have CHF, Figure 1.
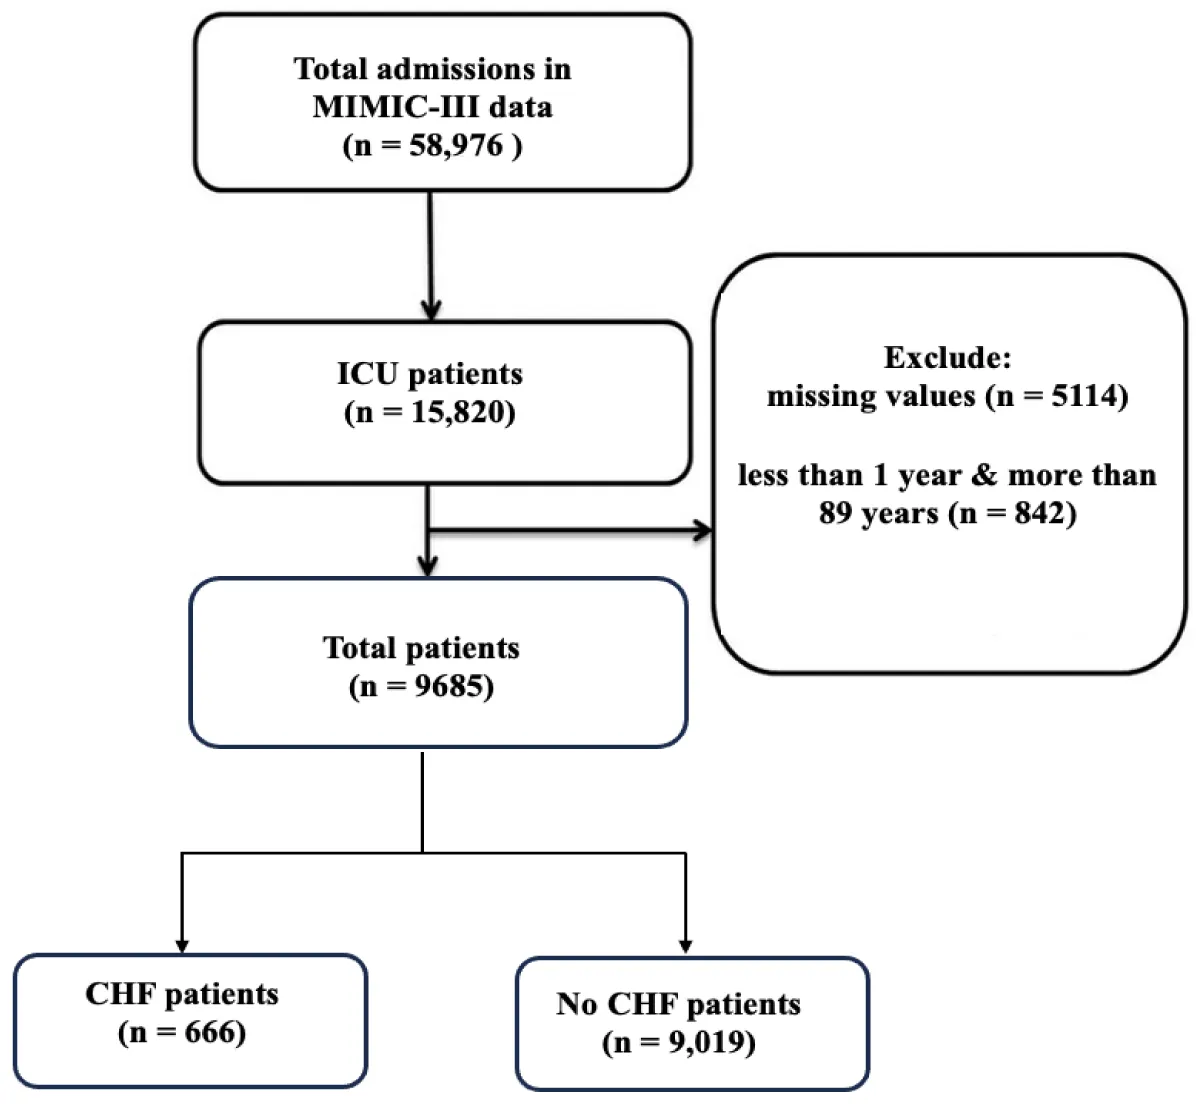
Figure 1: Flow chart of patient selection. ICU: Intensive Care Unit; CHF: Congestive Heart Failure
Outcome
The case group encompassed individuals who presented to the emergency department (ED) with a confirmed diagnosis of CHF. These patients exhibited symptoms and clinical findings consistent with CHF. The CHF diagnoses were established following standard clinical criteria using the ICD9 code. The control group was comprised of patients without a diagnosis of congestive heart failure. These individuals visited the ED during the same period as the case group. The absence of CHF in control patients was validated by reviewing their medical records and excluding cases with any documented history of CHF.
Pretreatment variables and data preprocessing
After performing univariate analysis, a total of 19 pretreatment variables were selected for inclusion in the machine learning (ML) models. These variables encompassed various aspects such as demographic information, liver function markers, cardiac enzymes, complete blood count parameters, serum electrolyte levels, patient length of stay (LoS), and other test measurements. To preprocess the data, categorical variables were converted into numerical values using one-hot encoding. For continuous variables with missing values, imputation was performed using the median value when the distribution of the variable was found to be non-normal [13]. The normality of the data distributions was assessed using the Shapiro-Wilk test [14], which examines the assumption of normality.
issing data
Fortunately, our dataset presented no missing values in the categorical variables. Nevertheless, in the case of continuous variables where more than 25% of data was absent, we adopted a strategy to enhance the trustworthiness and effectiveness of our Machine Learning models. These variables were pruned from the subsequent analysis.
Regarding the treatment of missing data in variables less than 25%, we applied an imputation technique [13,15,16] using R programming software, specifically using the median value. In this method, for each variable with missing entries, we substituted those missing values with the median value of that variable. The median is selected because it represents the middle value in a dataset, making it a robust choice in cases where data may be skewed or contain outliers. This approach helped us maintain the integrity and completeness of our dataset, enabling more reliable model training and analysis.
Traditional logistic regression model and feature selection
In our study, we opted to include the traditional logistic regression (LR) model [17] as a benchmark for evaluating the performance of machine learning models in assisting the triage, resource allocation, and prognostication of congestive heart failure (CHF) patients in the emergency department (ED). To identify the significant variables for our analysis, we initially conducted univariate logistic regression analysis. This analysis helped us determine which variables had a significant impact on the outcome. The most important variables were determined by their standardized correlation coefficients [18] and were selected and entered into the multivariate logistic regression model. This comprehensive model allowed us to assess the combined influence of multiple variables on the prediction.
Machine learning models
Machine learning, a subset of artificial intelligence (AI), enables the extraction of valuable insights from data [19]. The process begins by selecting an algorithm, and model parameters which are initially assigned randomly. The model is then trained using a subset portion of the data to establish its patterns and relationships. Through iterative steps, the model gradually adjusts its trainable parameters to optimize its performance. Once the training phase is completed, all model parameters are fixed. To assess the model’s performance, a separate test dataset, distinct from the training data, was used.
In this study, we employed extreme gradient boosting (XGBoost) [20] and random forest (RF) model [21] and compared their performance to traditional logistic regression model [17].
XGBoost (Extreme gradient boosting)
XGBoost is a powerful and efficient gradient-boosting algorithm known for its high performance in both structured and tabular data. Some key features and characteristics of XGBoost include: XGBoost is based on the gradient boosting framework, which builds an ensemble of decision trees sequentially, each tree correcting errors made by the previous ones. It incorporates L1 (Lasso) and L2 (Ridge) regularization techniques to prevent overfitting, making it robust against noisy data. It uses a technique called “tree pruning” to remove branches that provide little to no additional predictive power, improving model efficiency. XGBoost can be efficiently parallelized, making it faster and more suitable for large datasets. In addition, it provides feature importance scores, helping you identify which features have the most impact on predictions [22].
Random forest
Random Forest is an ensemble learning method that uses multiple decision trees to make predictions. Random Forest builds a collection of decision trees, where each tree is trained on a random subset of the data and a random subset of the features. It uses a technique called bagging to reduce overfitting. Bagging involves creating multiple subsets of the training data through resampling, and each tree is trained on one of these subsets. Random Forest can also provide feature importance scores, allowing you to understand the contribution of each feature to the model’s predictions. Random Forest is robust to outliers and noisy data, making it a good choice when dealing with real-world datasets. Finally, like XGBoost, Random Forest can be easily parallelized, making it suitable for large datasets and distributed computing environments [23].
Traditional logistic regression
Traditional logistic regression is a statistical method used for binary classification tasks, where the outcome variable has only two possible classes or categories (e.g., Yes/No, 1/0, True/False) [24]. Logistic regression models the relationship between a binary dependent variable (target) and one or more independent variables (predictors) using the logistic function [25]. The logistic function, also known as the sigmoid function, transforms linear combinations of predictors into probabilities. Unlike linear regression, which predicts continuous values, logistic regression predicts probabilities that an observation belongs to a particular class. These probabilities are then thresholded to make binary predictions. In logistic regression, coefficients associated with each predictor variable indicate the direction and strength of their impact on the log odds of the event occurring. Positive coefficients increase the log odds, while negative coefficients decrease them. Traditional logistic regression is a fundamental tool in statistics, offering a clear and interpretable way to model binary classification problems.
To evaluate the contribution of each variable, we employed different methods for each model. For the XGBoost model, we utilized a metric called “gain” to measure the improvement in model performance associated with each feature’s use in splitting the tree nodes [21]. In the case of the RF model, we ranked the important features based on their information gain, which reflects the decrease in impurity achieved through their inclusion [23]. Finally, we compared the important variables identified by each model with those determined using the traditional logistic regression model. By employing these machine learning techniques in traditional logistic regression and evaluating the importance of variables, we gained insights into the relevance and impact of different features on the models’ performance. This comprehensive analysis allows for a deeper understanding of the predictive capabilities and interpretability of the models, enhancing the overall findings of the study.
Training and validation of the machine learning models
In this study, we employed a 10-fold cross-validation technique for training the model and evaluating the testing data. This approach has been reported to ensure robustness and provide a reliable estimation of the model performance. The entire dataset was divided into ten (10) non-overlapping folds, each containing both training data and test data (Figure 2). For each iteration, the model was trained exclusively on the training data, allowing it to learn from the patterns and relationships within the dataset. The advantage of using a k-fold cross-validation method lies in its ability to provide a more accurate estimation of model performance by capturing the variance in performance across different fold combinations. This widely adopted technique has been proven effective in various studies [27,28] enabling researchers to obtain more reliable and generalizable results.
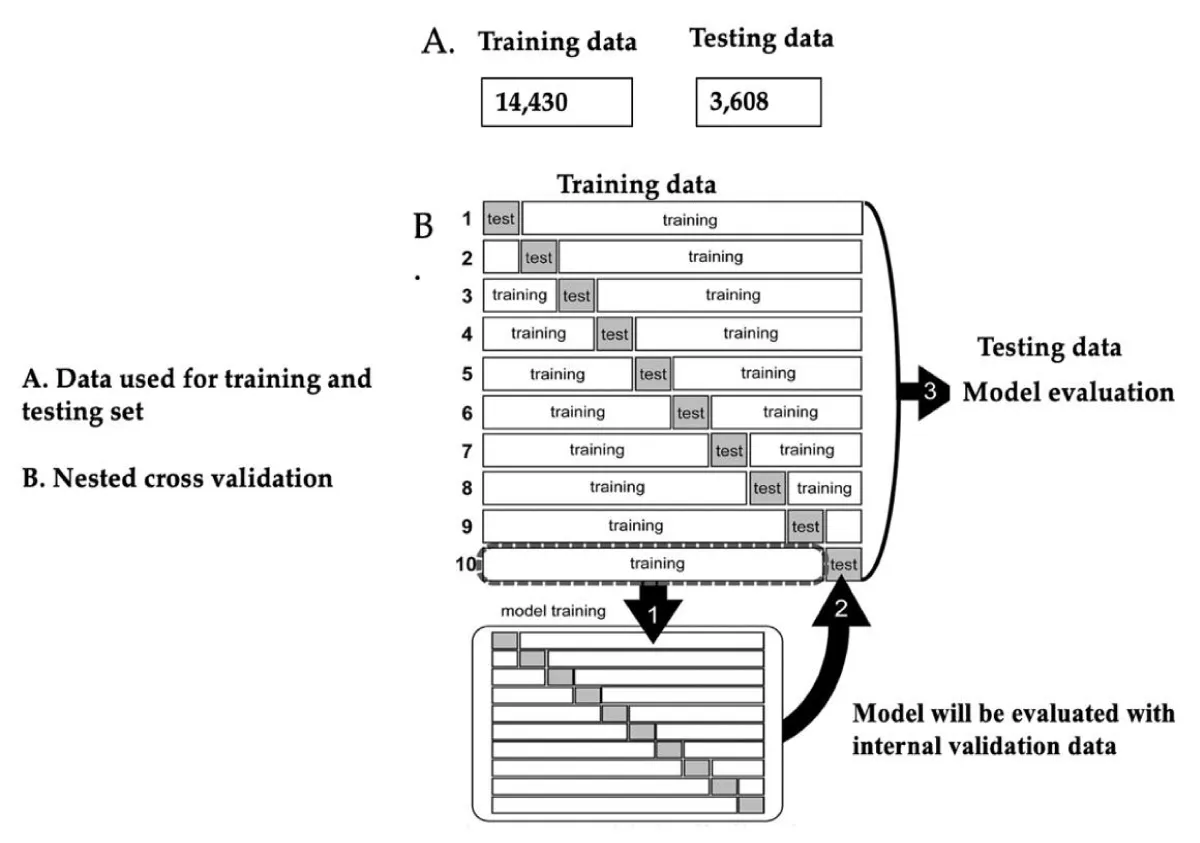
Figure 2: A. Data used for training and testing portion. B. Nested cross-validation. This figure was extracted from [26] and was modified in the context of our study.
The study employed a systematic approach to training and validating machine learning models using training data. Patients in the training set were randomly divided into training and test data, ensuring no duplication. Each type of training data underwent training and validation using a 10-fold cross-validation method to assess the model’s predictive ability [26]. The best-performing model from the training data was then validated on the test data to further evaluate its performance. Lastly, the trained models underwent external validation using data from separate test data. This rigorous process allowed for a comprehensive assessment of the models’ accuracy and generalizability.
During the training phase, the machine learning model underwent optimization of its hyperparameters using a grid search algorithm. Grid search is a systematic approach to fine-tuning the model’s hyperparameters in a step-by-step manner. In this study, the training data was split into inner training data and test data using 10-fold cross-validation, also known as nested cross-validation [26]. The purpose of this approach was to assess the model’s performance by evaluating its effectiveness on the inner test data while ensuring no information about the true (outer) test data was leaked.
Using this methodology, the model’s parameters were fine-tuned without any knowledge of the actual test data, thus preventing bias in the optimization process. Following the derivation of the model, performance metrics such as sensitivity, specificity, accuracy, and area under the curve (AUC) were calculated for each set of test data. This resulted in 10 different values for each evaluation score, representing the variability of the model’s performance. The models are developed and validated using the Python scikit-learn library. This library provided the necessary tools for implementing the model algorithms, performing cross-validation, and executing the grid search for hyperparameter optimization.
Testing dataset
Following the completion of model training and internal validation, the performance of each model was assessed using the testing data. This step aimed to evaluate the generalizability and predictive accuracy of the models beyond the initial training dataset. The AUC was used as a metric to measure the discriminative ability of the models. Furthermore, a comprehensive comparison was conducted between various machine learning models and traditional statistical models. This analysis sought to determine the relative superiority of the different modelling approaches in terms of their predictive performance. By examining and contrasting the AUC values, insights were gained into the strengths and limitations of each model, allowing for informed decision-making regarding the most suitable approach for clinical use.
Data analysis
The study employed descriptive statistics to analyze continuous variables. Normally distributed variables were expressed as mean ± standard deviation, while non-normally distributed variables were presented as median with interquartile range (25th - 75th percentile) [29]. In order to assess the superiority of the ML models over the traditional LR model, the study selected the ML model with the lowest performance and compared it to the traditional LR model. The comparison of the model’s AUCs was conducted using the Mann-Whitney U test with Bonferroni correction on the testing data. This comparison allowed for a comprehensive evaluation of the model’s performance in terms of their predictive capabilities to assess the models’ discriminative ability and determine if there were any statistically significant differences in their performance. To determine statistical significance, two-sided p values of less than 0.05 were considered. All statistical analyses were conducted using R version 4.3.0 (2023-04-21) and Python ensuring a standardized and consistent approach to data analysis.
Baseline characteristics
The study included 9,685 patients in the emergency department (ED), 7.4% (n = 666) had developed Congestive Heart Failure. The median age for both CHF and no CHF groups was 67 years with a similar gender distribution of males 58% in both groups. Cardiac Enzymes and Complete Blood Count (CBC) Parameters showed significant differences between the two groups. Liver Function Markers like total bilirubin levels were significantly different in both CHF and no CHF groups with 0.6 mg/dl and 0.63 mg/dl respectively, while other markers remained similar in both groups. The median length of stay (LoS) was 11 days for both CHF and no CHF groups. The table below suggests a potential association between these factors and the presence of CHF (Table 1).
| Table 1: Baseline characteristics of CHF and no CHF patients in the emergency department. | ||
| Variables | No CHF (n = 9,019) | CHF (n = 666) |
| Demographics | ||
| Age (yrs.), median (min-max) | 67 (15 – 88) | 67 (18 – 88) |
| Gender (Male) n (%) | 5,259 (58) | 388 (58) |
| Cardiac Enzymes | ||
| Creatine Kinase (IU/L) | 116.2 (56.25 – 321.64) | 111.25 (56.63 – 361.12) |
| Complete Blood Count (CBC) parameters | ||
| MCH (pg.) | 30.31 (29.03 – 31.54) | 30.27 (29.02 – 31.38) |
| Platelet count (K/uL) | 222.7 (159.5 – 279.7) | 219.3 (160.8 – 291.7) |
| RBC (m/uL) | 3.54 (3.16 – 3.8) | 3.42 (3.14 – 3.77) |
| WBC (K/uL) | 10.73 (8.37 – 13.83) | 10.85 (8.29 – 13.45) |
| Liver function markers | ||
| Albumin (g/dL) | 3.1 (2.62 – 3.55) | 3.1 (2.66 – 3.6) |
| Total bilirubin (mg/dL) | 0.63 (0.4 – 1.12) | 0.6 (0.4 – 0.995) |
| Creatinine (mg/dL) | 1.06 (0.77 – 1.77) | 1.08 (0.77 – 1.68) |
| ALP (IU/L) | 89.25 (66.5 – 127.28) | 87 (64 – 125.97) |
| ALT (IU/L) | 30 (18 – 62.87) | 29 (18.69 - 56.45) |
| Electrolyte levels | ||
| Potassium (mEq/L) | 4.07 (3.86 – 4.32) | 4.1 (3.86 – 3.34) |
| Calcium (mg/dL) | 8.37 (8 – 8.77) | 8.39 (8.01 – 8.75) |
| Magnesium (mEq/L) | 2.03 (1.9 – 2.17) | 2.02 (1.9 – 2.17) |
| Phosphate (mg/dL) | 3.45 (3 – 4.02) | 3.46 (3.01 – 4.06) |
| Sodium (mEq/L) | 138.9 (136.7 – 141.12) | 138.98 (136.4 – 141.02) |
| Other measures | ||
| pC02 (mmHg) | 40 (36 – 44.25) | 40.25 (36.31 – 44.89) |
| INR | 1.3 (1.16 – 1.58) | 1.3 (1.15 – 1.597) |
| LoS (days) | 11 (6 – 18) | 11 (5 - 18) |
| WBC: White Blood Cell; RBC: Red Blood Cell; ALP: Alkaline Phosphate; ALT: Alanine Aminotransferase; INR: International Normalized Ratio; MCH: Mean Corpuscular Hemoglobin; pCO2: partial Pressure of Carbon Dioxide; LoS: Length of Stay; mg/dl: milligrams per deciliter; pg: picograms; IU/L: International Units per Litre; cm: centimetre (cm); yrs: Years; S.D: Standard Deviation; K/uL: Thousand per microliter; m/uL: million per microliter, %: Percentage, mEq/L: milliequivalents per liter. Continuous values that are normally distributed were recorded as mean (S.D) and others were input as median (IQR), and categorical values (absolute numbers and percentages). The Chi-square test was used for the comparison ofcategorical variables and the two-sample t - test for continuous variables. | ||
Comparison between the machine learning models and traditional logistic regression models
Comparatively, the Machine Learning Models (RF and XGBoost) perform significantly better across all metrics (Table 2). The AUROC metric is particularly notable: Traditional LR: 57%, RF: 98%, and XGB: 99% respectively, indicating the ability of the models to discriminate between positive and negative classes (Figure 3). The results demonstrate that the Machine Learning Models, RF, and XGBoost outperform the Traditional Logistics Regression model in terms of accuracy, recall, specificity, AUROC, precision, and F1 score. These findings suggest that the Machine Learning models offer improved predictive capabilities for the given task.
| Table 2: Scores for Each Model With 10-fold Cross-Validation (Table view). | ||||||
| Models | Accuracy | Recall | Specificity | AUROC | Precision | F1 score |
| Traditional LR | 0.55 | 0.55 | 0.57 | 0.57 | 0.56 | 0.56 |
| Machine learning models | ||||||
| RF | 0.93 | 0.95 | 0.95 | 0.98 | 0.92 | 0.94 |
| XGBoost | 0.95 | 0.95 | 0.95 | 0.99 | 0.96 | 0.95 |
| AUROC: Area Under Receiver Operator Characteristic; LR: Logistic Regression; RF: Random Forest; XGBoost: Extreme Gradient Boosting. | ||||||
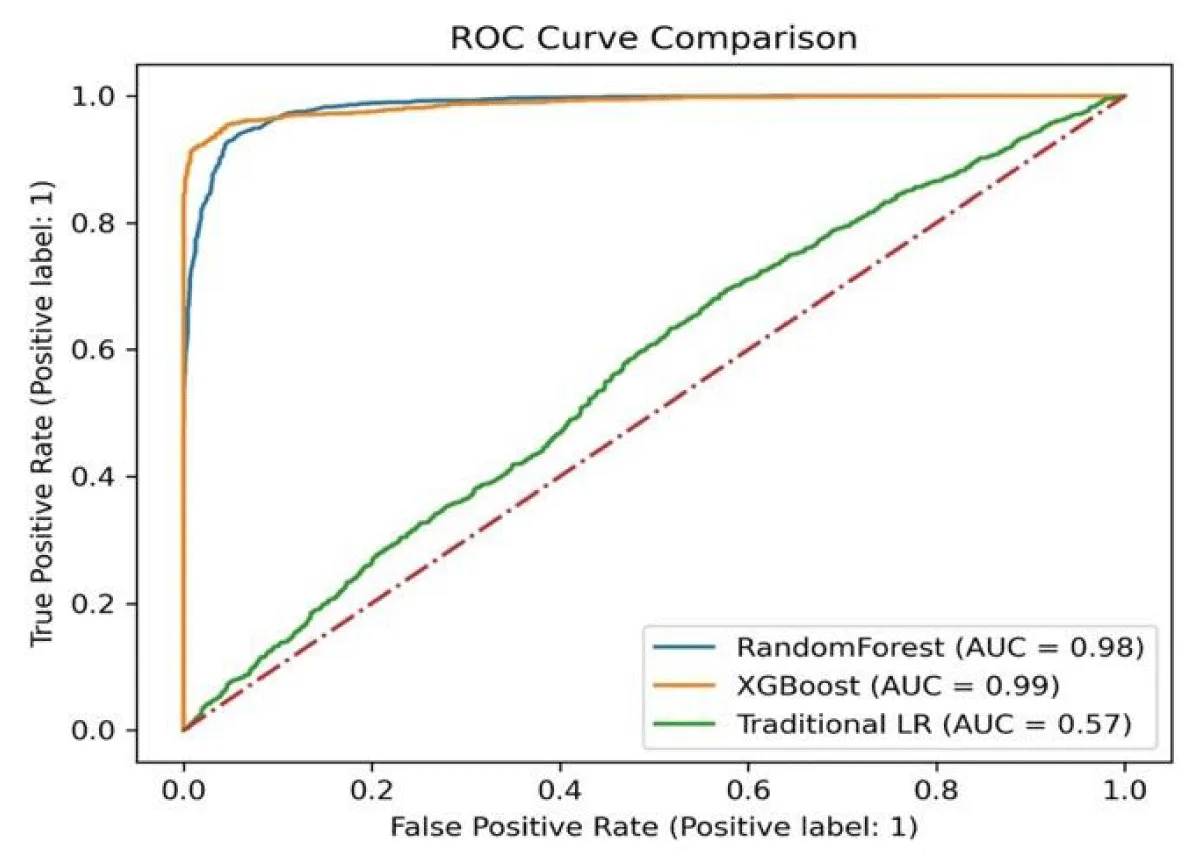
Figure 3: The receiver operating characteristic curves of the machine learning models, and traditional logistic regression model.
Because the RF model had the lower performance among the two machine learning models (Table 2), the RF model was compared with the traditional LR model. The AUC of the RF was significantly higher than traditional LR using the Mann-Whitney U test with Bonferroni correction on the testing data. (RF vs. traditional LR, p -value = 0.0001), Figure 4.
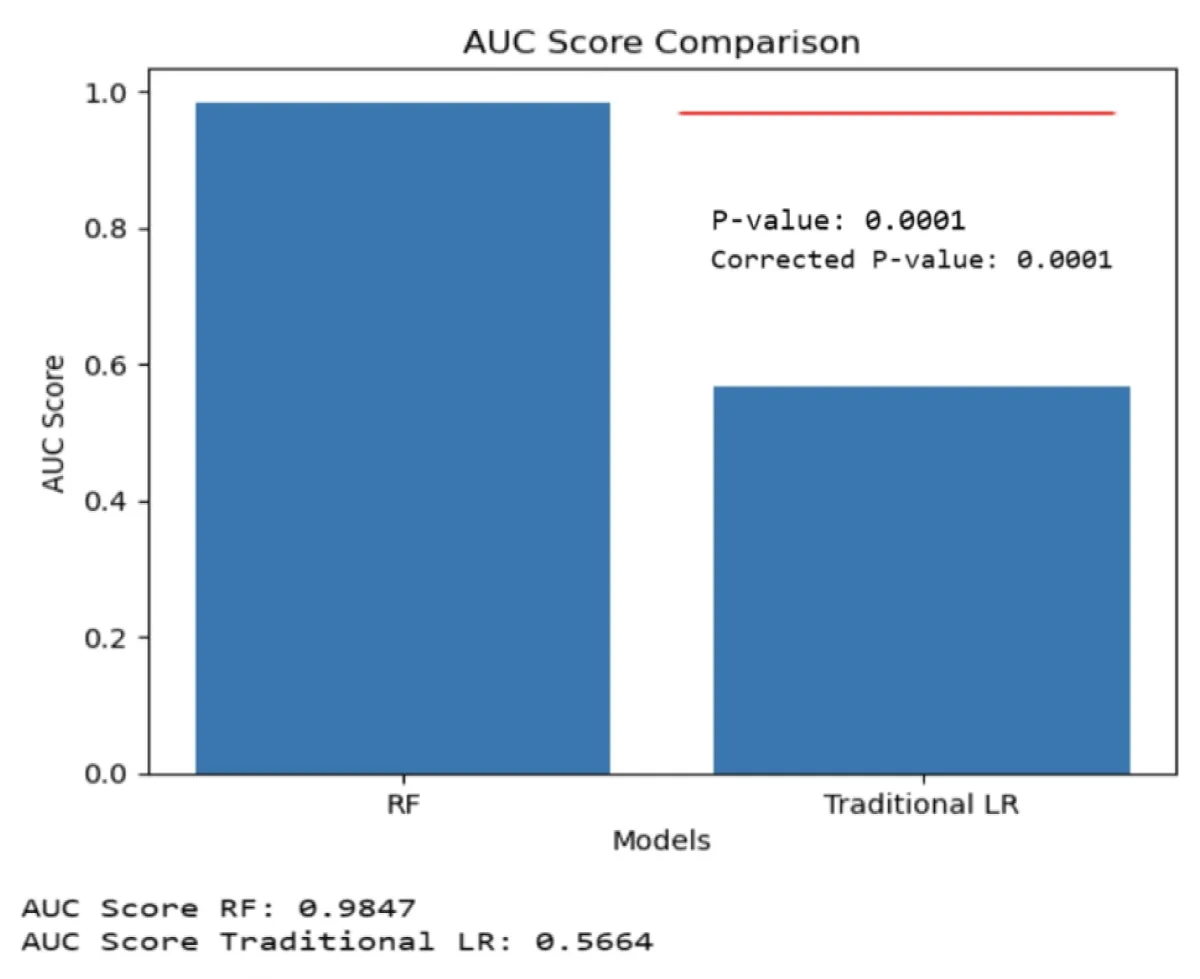
Figure 4: A bar graph displaying the mean ± 95% CI of the receiver operating characteristic area under the curve (AUC) is presented for the testing data. Significant differences were observed between the RF model, which performed the least, and the traditional LR model. The statistical comparison was conducted using the Mann-Whitney U test with Bonferroni correction [30].
Multivariate analysis
The results obtained through multivariate logistic regression analysis, as shown in Table 3, reveal key factors associated with CHF. It’s noteworthy that several variables, such as age, creatine kinase, Mean Corpuscular Hemoglobin (MCH), platelet count, red blood cell count, ALP, ALT, magnesium, and sodium, exhibit a tendency for CHF risk to increase by a factor of 1 with each unit increase (OR: 1.9, 1.16, 1.0078, 1.0002, 1.09, 1.0001, 1.0001, 1.24, 1.02), respectively. Conversely, variables like gender, white blood cell count, creatinine, albumin, potassium, calcium, pCO2, and INR demonstrate a significant protective effect, as their odds ratios (OR) are less than 1, indicating a reduced risk of CHF associated with these factors. Furthermore, the protective effects observed in variables like gender, white blood cell count, creatinine, albumin, potassium, calcium, pCO2, and INR suggest the potential for modifiable elements that could be explored in preventive strategies for managing CHF risk.
| Table 3: Multivariate analysis of factors for CHF. | |||
| Variables | Adjusted Odd Ratio | 95% Confidence Interval | p - value |
| Age (yrs.) | 1.9000 | (0.9932,1.0037) | 0.059* |
| Gender | 0.9700 | (0.82,1.15) | 0.753 |
| Creatine Kinase (IU/L) | 1.1600 | (1.00,1.19) | 0.011* |
| MCH (pg) | 1.0078 | (0.9697,1.0474) | 0.013* |
| Platelet count (K/uL) | 1.0002 | (0.9995,1.001) | 0.021* |
| RBC (m/uL) | 1.0900 | (0.92,1.31) | 0.015* |
| WBC (K/uL) | 0.9935 | (0.9796,1.0076) | 0.303 |
| Albumin (g/dL) | 0.9300 | (0.79,1.09) | 0.350 |
| Total bilirubin (mg/dL) | 1.0200 | (0.99,1.04) | 0.055* |
| Creatinine (mg/dL) | 0.9700 | (0.9,1.04) | 0.377 |
| ALP (IU/L) | 1.0001 | (0.9994,1.0008) | 0.706 |
| ALT (IU/L) | 1.0001 | (0.9999,1.0002) | 0.453 |
| Potassium (mEq/L) | 0.8900 | (0.7,1.13) | 0.329 |
| Calcium (mg/dL) | 0.9913 | (0.8591,1.1439) | 0.905 |
| Magnesium (mEq/L) | 1.2400 | (0.9,1.73) | 0.020* |
| Phosphate (mg/dL) | 1.0700 | (0.97,1.18) | 0.184 |
| Sodium (mEq/L) | 1.0200 | (1,1.04) | 0.046* |
| pC02 (mmHg) | 0.9999 | (0.9911,1.0087) | 0.977 |
| INR | 0.9900 | (0.89,1.1) | 0.021* |
| WBC: White Blood Cell, RBC: Red Blood Cell; ALP: Alkaline Phosphate; ALT: Alanine Aminotransferase; INR: International Normalized Ratio; MCH: Mean Corpuscular Hemoglobin; pCO2: partial pressure of Carbon Dioxide; LoS: Length of Stay; mg/dl: milligrams per deciliter; pg: picograms; IU/L: International Units Per Litre; cm: centimeter (cm); yrs: years; S.D: Standard Deviation; K/uL: Thousand Per Microliter; m/uL: million per microliter; %: Percentage; mEq/L: milliequivalents per liter. Continuous values that are normally distributed were recorded as mean (S.D) and others were input as median (IQR), and categorical values (absolute numbers and percentages). The Chi-square test was used for the comparison of categorical variables and the two-sample t - test for continuous variables. All p values were two-sided. Statistical significance was defined as p < 0.05. * Statistically significant. | |||
Important variables of the machine learning models
The features are ranked based on their relative importance in predicting congestive heart failure in the emergency department in each of the individual models. The importance of features may vary across different models, indicating the unique characteristics and patterns each model identifies. This information is useful for understanding the factors that contribute significantly to the model’s predictions and gaining insights into the relationship between these features and CHF (Table 4).
| Table 4: Top 10 Important Features in the Models (Table view). | |||
| Top 10 | Traditional LR model | Machine Learning Models | |
| Logistic Regression | Random forest | XGBoost | |
| 1 | gender | total bilirubin | total bilirubin |
| 2 | creatine kinase | creatinine | Magnesium |
| 3 | total bilirubin | creatine kinase | creatine kinase |
| 4 | phosphate | INR | albumin |
| 5 | sodium | ALT | platelet |
| 6 | creatinine | platelet | INR |
| 7 | calcium | age | ALT |
| 8 | magnesium | potassium | ALP |
| 9 | albumin | ALP | creatinine |
| 10 | ALP | WBC | potassium |
| WBC: White Blood Cell; ALP: alkaline Phosphate; ALT: Alanine Aminotransferase; INR: international Normalized Ratio. | |||
To the best of our knowledge, this study is the first to compare the predictive ability of machine learning (ML) models and the traditional logistic regression (LR) using pretreatment features in the emergency department (ED) for assisting physicians in resource allocation and triage of congestive heart failure (CHF) patients. The results of the study demonstrate that all the ML models had significantly superior predictive ability compared to the traditional LR model. This highlights the potential of ML methods to outperform traditional LR approaches in assisting with the triage, resource allocation, and long-term prognostication of CHF patients in the ED.
In the testing cohort, the ML models, Random Forest (RF) and XGBoost, achieved higher area under the curve (AUC) scores of 0.98 and 0.99 respectively, surpassing the predictive performance of the previously reported ML models with pretreatment covariates [16-18]. The study included 19 pretreatment variables collected prior to initiating treatment of patients with CHF in the ED. One notable difference between the traditional LR model and the ML models lies in the ML algorithm’s ability to handle non-linearity and effectively address challenges associated with multifactorial models, such as collinearity and overfitting. Collinearity of variables can pose a significant problem when performing feature selection [31].
Our study demonstrates the top 10 variables that were important by the ML models and traditional LR. The combined ten variables from the three models are total bilirubin, creatine kinase, INR, sodium, age, creatinine, potassium, gender, ALP, and platelet. Different studies also show the relationship between serum electrolytes and CHF. Serum sodium, potassium, and calcium levels have prognostic value as predictors of mortality in patients with chronic CHF. They also play a role in the prediction of short-term mortality for patients admitted with heart failure [32-34] also indicated that serum bilirubin and creatinine levels are prognostic values of CHF. In CHF, there is evidence of enhanced platelet activation and increased platelet aggregation. This abnormal platelet function can contribute to the pro-thrombotic state, promoting clot formation and impairing blood flow through the already compromised cardiovascular system [35,36]. In CHF patients, the heart’s inability to effectively pump blood can lead to fluid accumulation and congestion in various organs, including the liver. Liver congestion can cause liver enzyme levels to increase, including ALT and ALP [37]. Elevated levels of ALT and ALP can indicate liver involvement secondary to CHF. Age is a major determinant of the risk for cardiovascular disease [38,39].
Age is a significant risk factor for CHF. The prevalence of CHF increases with advancing age, and it is more commonly observed in older individuals [40-42]. CHF becomes more prevalent as people get older. The risk of developing CHF doubles for every decade after the age of 60. This is due to a combination of factors, including age-related changes in the heart, increased prevalence of underlying cardiovascular conditions, and cumulative exposure to risk factors over time [43]. In CHF, the heart muscle can be under strain and experience damage. When heart muscle cells are injured or undergo necrosis (cell death), CK is released into the bloodstream [44]. Therefore, elevated creatine kinase levels can indicate myocardial damage, which can occur in CHF [45].
The top 10 features selected by the models can have implications for the triage, resource allocation, and prognostication of CHF patients. For triage, triage involves prioritizing patients based on the severity of their condition. By identifying the important variables, the model can assist in accurately assessing the severity of CHF in patients upon admission. This information can aid in determining the urgency of medical intervention and the appropriate level of care required for each patient. Regarding resource allocation, resource allocation refers to the efficient distribution of healthcare resources based on patient needs. The identified variables can provide insights into the specific characteristics or risk factors associated with CHF. This information can guide healthcare providers in allocating resources such as specialized medical equipment, personnel, and facilities to effectively manage and treat CHF patients. For prognostication, prognostication involves predicting the likely course and outcome of a disease. The four important variables identified by the model may be associated with specific prognostic indicators or predictive factors for CHF patients. By incorporating these variables into the model, healthcare providers can obtain more accurate prognostic assessments for individual patients. This information can help in making informed decisions regarding treatment plans, follow-up care, and potential interventions to improve patient outcomes.
Clinical implication of our findings
The study’s findings on “Developing a Machine Learning Algorithm for Improved Management of Congestive Heart Failure Patients in the Emergency Department” have several clinical implications:
Triage and resource allocation: The machine learning algorithm developed in this study can assist in prioritizing CHF patients in the emergency department based on their predicted risk or severity. This can optimize resource allocation and enable timely interventions for high-risk patients.
Prognostication and long-term management: By incorporating pretreatment features, the machine learning algorithm improves long-term prognostication for CHF patients. It helps identify individuals at higher risk of adverse outcomes or requiring specialized interventions, enabling tailored treatment plans and close monitoring for improved long-term management.
Comparative analysis: Comparing the machine learning algorithm with traditional logistic regression provides valuable insights into the performance and effectiveness of different approaches. The study’s results indicate that the machine learning algorithm demonstrates superior predictive performance, suggesting its potential adoption in CHF patient management to enhance outcomes and resource utilization.
Individualized patient care: The machine learning algorithm’s capability to consider various pretreatment features enables personalized patient care. By uncovering previously unrecognized patterns or relationships, the algorithm informs tailored treatment plans and interventions for CHF patients, optimizing care delivery and potentially improving patient outcomes and satisfaction.
Limitations
There are several limitations associated with this study. Firstly, in order to mitigate the risk of overfitting, we employed a nested cross-validation approach. This technique involves training and fine-tuning the model in the inner layer while estimating its performance in the outer layer, thereby enabling unbiased training without any knowledge of the external testing data. However, it is worth noting that this double-layered analysis framework may be intricate for a relatively small dataset. Secondly, while the machine learning models exhibited superior performance compared to traditional logistic regression, it is crucial to validate the developed algorithm on independent and external datasets. This validation process ensures that the algorithm’s performance remains consistent and reliable across diverse patient populations and healthcare settings. Finally, B-type natriuretic peptide (BNP) and the N-terminal fragment (NT-proBNP) are among the established biomarkers in the diagnosis of CHF, the present study did not include them because the missing values in them are high. Including these features can increase the model performance and assist in triage, resource allocation, and long-term prognostication of CHF patients.
The machine learning models utilized in the study demonstrated better performance compared to traditional logistic regression, indicating their potential in enhancing patient management and decision-making processes paving the way for more efficient and personalized care strategies in the future. The ML model was also superior to the traditional logistic regression. If the model is subjected to further validation, the machine learning model may become a useful tool to assist in the triage, resource allocation, and long-term prognostication of CHF patients. It is important to note that the findings of this study provide valuable insights into the potential of ML models in improving the management of CHF patients in the ED. Further validation and assessment of larger and more diverse patient populations are warranted to establish the generalizability and robustness of these models in real-world clinical settings.
Author contributions
K Bah, Ns Bah AW Jallow, and Dr M Touray conceived the study. K Bah was responsible for the methodology; K Bah, Ns Bah, and AW Jallow managed the software; K Bah, Ns Bah, AW Jallow Dr. M Touray were responsible for validation; K Bah, Ns Bah, AW Jallow and Dr. M Touray conducted the formal analysis; K Bah, Ns Bah and AW Jallow conducted the investigation; K Bah, Ns Bah, and AW Jallow were responsible for data curation; K Bah, Ns Bah and AW Jallow wrote the original draft; K Bah, Ns Bah, AW Jallow and Dr M Touray reviewed and edited the draft. All authors have read and agreed to the published version of the manuscript.
Institutional review board statement
Our study fulfilled all the necessary conditions for gaining access to the database, which involved successfully completing prerequisite training courses in areas like Human Research, Data or Specimens Only Research, and the fundamental 1-Basic Course. We also ensured our compliance with the database’s terms and conditions by acquiring the required data user credentials (Record ID: 55140935). Furthermore, our study was conducted in strict accordance with the ethical principles outlined in the Declaration of Helsinki.
Informed consent statement
Patient consent was waived due to the data used being anonymous from the MIMIC III database.
Data availability statement
The data that was generated and/or analyzed during the current study are not publicly available due to the MIMIC III data policy and rules but are available from the corresponding author upon reasonable request.
The data was acquired from Medical Information Mart for Intensive Care (MIMIC-III 1.4).
- Benjamin EJ, Blaha MJ, Chiuve SE, Cushman M, Das SR, Deo R, de Ferranti SD, Floyd J, Fornage M, Gillespie C, Isasi CR, Jiménez MC, Jordan LC, Judd SE, Lackland D, Lichtman JH, Lisabeth L, Liu S, Longenecker CT, et al. American Heart Association Statistics Committee and Stroke Statistics Subcommittee. Heart Disease and Stroke Statistics-2017 Update: A Report From the American Heart Association. Circulation. 2017 Mar 7;135(10):e146-e603. doi: 10.1161/CIR.0000000000000485. Epub 2017 Jan 25. Erratum in: Circulation. 2017 Mar 7;135(10 ):e646. Erratum in: Circulation. 2017 Sep 5;136(10 ):e196. PMID: 28122885; PMCID: PMC5408160.
- Braunwald E, Bristow MR. Congestive heart failure: fifty years of progress. Circulation. 2000 Nov 14;102(20 Suppl 4):IV14-23. doi: 10.1161/01.cir.102.suppl_4.iv-14. PMID: 11080127.
- Averbuch T, Lee SF, Mamas MA, Oz UE, Perez R, Connolly SJ, Ko DT, Van Spall HGC. Derivation and validation of a two-variable index to predict 30-day outcomes following heart failure hospitalization. ESC Heart Fail. 2021 Aug;8(4):2690-2697. doi: 10.1002/ehf2.13324. Epub 2021 May 1. PMID: 33932113; PMCID: PMC8318488.
- Averbuch T, Sullivan K, Sauer A, Mamas MA, Voors AA, Gale CP, Metra M, Ravindra N, Van Spall HGC. Applications of artificial intelligence and machine learning in heart failure. Eur Heart J Digit Health. 2022 May 13;3(2):311-322. doi: 10.1093/ehjdh/ztac025. PMID: 36713018; PMCID: PMC9707916.
- Cook JA, Collins GS. The rise of big clinical databases. Br J Surg. 2015 Jan;102(2):e93-e101. doi: 10.1002/bjs.9723. PMID: 25627139.
- Alaskar H, Saba T. Machine learning and deep learning: a comparative review. Proceedings of Integrated Intelligence Enable Networks and Computing: IIENC 2020. 2021; 143-150.
- Ayodele TO. Machine learning overview. New Advances in Machine Learning. 2010; 2: 9-18.
- Lim YMF, Molnar M, Vaartjes I, Savarese G, Eijkemans MJC, Uijl A, Vradi E, Suzart-Woischnik K, Brugts JJ, Brunner-La Rocca HP, Blanc-Guillemaud V, Couvelard F, Baudier C, Dyszynski T, Waechter S, Lund LH, Hoes AW, Tyl B, Asselbergs FW, Gerlinger C, Grobbee DE, Cronin M, Koudstaal S. Generalizability of randomized controlled trials in heart failure with reduced ejection fraction. Eur Heart J Qual Care Clin Outcomes. 2022 Oct 26;8(7):761-769. doi: 10.1093/ehjqcco/qcab070. PMID: 34596659; PMCID: PMC9603541.
- Gulati G, Upshaw J, Wessler BS, Brazil RJ, Nelson J, van Klaveren D, Lundquist CM, Park JG, McGinnes H, Steyerberg EW, Van Calster B, Kent DM. Generalizability of Cardiovascular Disease Clinical Prediction Models: 158 Independent External Validations of 104 Unique Models. Circ Cardiovasc Qual Outcomes. 2022 Apr;15(4):e008487. doi: 10.1161/CIRCOUTCOMES.121.008487. Epub 2022 Mar 31. PMID: 35354282; PMCID: PMC9015037.
- Cowie MR, Blomster JI, Curtis LH, Duclaux S, Ford I, Fritz F, Goldman S, Janmohamed S, Kreuzer J, Leenay M, Michel A, Ong S, Pell JP, Southworth MR, Stough WG, Thoenes M, Zannad F, Zalewski A. Electronic health records to facilitate clinical research. Clin Res Cardiol. 2017 Jan;106(1):1-9. doi: 10.1007/s00392-016-1025-6. Epub 2016 Aug 24. PMID: 27557678; PMCID: PMC5226988.
- Weissler EH, Naumann T, Andersson T, Ranganath R, Elemento O, Luo Y, Freitag DF, Benoit J, Hughes MC, Khan F, Slater P, Shameer K, Roe M, Hutchison E, Kollins SH, Broedl U, Meng Z, Wong JL, Curtis L, Huang E, Ghassemi M. The role of machine learning in clinical research: transforming the future of evidence generation. Trials. 2021 Aug 16;22(1):537. doi: 10.1186/s13063-021-05489-x. Erratum in: Trials. 2021 Sep 6;22(1):593. PMID: 34399832; PMCID: PMC8365941.
- Johnson AE, Pollard TJ, Shen L, Lehman LW, Feng M, Ghassemi M, Moody B, Szolovits P, Celi LA, Mark RG. MIMIC-III, a freely accessible critical care database. Sci Data. 2016 May 24;3:160035. doi: 10.1038/sdata.2016.35. PMID: 27219127; PMCID: PMC4878278.
- Stekhoven DJ, Bühlmann P. MissForest--non-parametric missing value imputation for mixed-type data. Bioinformatics. 2012 Jan 1;28(1):112-8. doi: 10.1093/bioinformatics/btr597. Epub 2011 Oct 28. PMID: 22039212.
- Ahad NA, Yin TS, Othman AR, Yaacob CR. Sensitivity of normality tests to non-normal data. Sains Malaysiana. 2011; 40(6): 637-641.
- Kaiser J. Dealing with Missing Values in Data. Journal Of Systems Integration. 2014; (1804-2724): 5(1).
- van der Heijden GJ, Donders AR, Stijnen T, Moons KG. Imputation of missing values is superior to complete case analysis and the missing-indicator method in multivariable diagnostic research: a clinical example. J Clin Epidemiol. 2006 Oct;59(10):1102-9. doi: 10.1016/j.jclinepi.2006.01.015. Epub 2006 Jul 11. PMID: 16980151.
- Xi Y, Wang H, Sun N. Machine learning outperforms traditional logistic regression and offers new possibilities for cardiovascular risk prediction: A study involving 143,043 Chinese patients with hypertension. Front Cardiovasc Med. 2022 Nov 14;9:1025705. doi: 10.3389/fcvm.2022.1025705. PMID: 36451926; PMCID: PMC9701715.
- Menard S. Standards for standardized logistic regression coefficients. Social Forces. 2011; 89(4): 1409-1428.
- Sarker IH, Furhad MH, Nowrozy R. Ai-driven cybersecurity: an overview, security intelligence modeling, and research directions. SN Computer Science. 2021; 2: 1-18.
- Chen T, He T, Benesty M, Khotilovich V, Tang Y, Cho H, Zhou T. Xgboost: extreme gradient boosting. R package version 0. 2015;4-2: 1(4); 1-4.
- Liu Y, Wang Y, Zhang J. New machine learning algorithm: Random forest. Paper presented at the Information Computing and Applications: Third International Conference, ICICA 2012, Chengde, China, September 14-16, 2012. Proceedings 3.
- Liu S, Yang B, Wang Y, Tian J, Yin L, Zheng W. 2D/3D multimode medical image registration based on normalized cross-correlation. Applied Sciences. 2022; 12(6): 2828.
- Breiman L. Random forests. Machine learning. 2001; 45: 5-32.
- Mishra VN, Kumar V, Prasad R, Punia M. Geographically weighted method integrated with logistic regression for analyzing spatially varying accuracy measures of remote sensing image classification. Journal of the Indian Society of Remote Sensing. 2021; 49: 1189-1199.
- Wilson JR, Lorenz KA, Wilson JR, Lorenz KA. Standard binary logistic regression model. Modeling binary correlated responses using SAS, SPSS, and R. 2015; 25-54.
- Nishi H, Oishi N, Ishii A, Ono I, Ogura T, Sunohara T, Chihara H, Fukumitsu R, Okawa M, Yamana N, Imamura H, Sadamasa N, Hatano T, Nakahara I, Sakai N, Miyamoto S. Predicting Clinical Outcomes of Large Vessel Occlusion Before Mechanical Thrombectomy Using Machine Learning. Stroke. 2019 Sep;50(9):2379-2388. doi: 10.1161/STROKEAHA.119.025411. Epub 2019 Aug 14. PMID: 31409267.
- Abedi V, Goyal N, Tsivgoulis G, Hosseinichimeh N, Hontecillas R, Bassaganya-Riera J, Elijovich L, Metter JE, Alexandrov AW, Liebeskind DS, Alexandrov AV, Zand R. Novel Screening Tool for Stroke Using Artificial Neural Network. Stroke. 2017 Jun;48(6):1678-1681. doi: 10.1161/STROKEAHA.117.017033. Epub 2017 Apr 24. PMID: 28438906.
- van Os HJA, Ramos LA, Hilbert A, van Leeuwen M, van Walderveen MAA, Kruyt ND, Dippel DWJ, Steyerberg EW, van der Schaaf IC, Lingsma HF, Schonewille WJ, Majoie CBLM, Olabarriaga SD, Zwinderman KH, Venema E, Marquering HA, Wermer MJH; MR CLEAN Registry Investigators. Predicting Outcome of Endovascular Treatment for Acute Ischemic Stroke: Potential Value of Machine Learning Algorithms. Front Neurol. 2018 Sep 25;9:784. doi: 10.3389/fneur.2018.00784. PMID: 30319525; PMCID: PMC6167479.
- Ceresoli M, Nespoli L. Analyzing Continuous Variables: Descriptive Statistics, Dispersion and Comparison. In Statistics and Research Methods for Acute Care and General Surgeons. 2022; 55-66. Springer.
- Lee S, Lee DK. What is the proper way to apply the multiple comparison test? Korean J Anesthesiol. 2018 Oct;71(5):353-360. doi: 10.4097/kja.d.18.00242. Epub 2018 Aug 28. Erratum in: Korean J Anesthesiol. 2020 Dec;73(6):572. PMID: 30157585; PMCID: PMC6193594.
- Papoutsoglou G, Tarazona S, Lopes MB, Klammsteiner T, Ibrahimi E, Eckenberger J, Novielli P, Tonda A, Simeon A, Shigdel R, Béreux S, Vitali G, Tangaro S, Lahti L, Temko A, Claesson MJ, Berland M. Machine learning approaches in microbiome research: challenges and best practices. Front Microbiol. 2023 Sep 22;14:1261889. doi: 10.3389/fmicb.2023.1261889. PMID: 37808286; PMCID: PMC10556866.
- Antoniades C, Tousoulis D, Koumallos N, Marinou K, Stefanadis C. Levosimendan: beyond its simple inotropic effect in heart failure. Pharmacol Ther. 2007 May;114(2):184-97. doi: 10.1016/j.pharmthera.2007.01.008. Epub 2007 Feb 16. PMID: 17363065.
- Cuthbert JJ, Pellicori P, Rigby A, Pan D, Kazmi S, Shah P, Clark AL. Low serum chloride in patients with chronic heart failure: clinical associations and prognostic significance. Eur J Heart Fail. 2018 Oct;20(10):1426-1435. doi: 10.1002/ejhf.1247. Epub 2018 Jun 26. PMID: 29943886.
- Shinagawa H, Inomata T, Koitabashi T, Nakano H, Takeuchi I, Naruke T, Ohsaka T, Nishii M, Takehana H, Izumi T. Prognostic significance of increased serum bilirubin levels coincident with cardiac decompensation in chronic heart failure. Circ J. 2008 Mar;72(3):364-9. doi: 10.1253/circj.72.364. PMID: 18296830.
- Barale C, Russo I. Influence of Cardiometabolic Risk Factors on Platelet Function. Int J Mol Sci. 2020 Jan 17;21(2):623. doi: 10.3390/ijms21020623. PMID: 31963572; PMCID: PMC7014042.
- Demirkol S, Balta S, Unlu M, Yuksel UC, Celik T, Arslan Z, Kucuk U, Yokusoglu M. Evaluation of the mean platelet volume in patients with cardiac syndrome X. Clinics (Sao Paulo). 2012 Sep;67(9):1019-22. doi: 10.6061/clinics/2012(09)06. PMID: 23018297; PMCID: PMC3438240.
- Grieve DJ, Cassidy RS, Green BD. Emerging cardiovascular actions of the incretin hormone glucagon-like peptide-1: potential therapeutic benefits beyond glycaemic control? Br J Pharmacol. 2009 Aug;157(8):1340-51. doi: 10.1111/j.1476-5381.2009.00376.x. PMID: 19681866; PMCID: PMC2765323.
- Crimmins EM, Shim H, Zhang YS, Kim JK. Differences between Men and Women in Mortality and the Health Dimensions of the Morbidity Process. Clin Chem. 2019 Jan;65(1):135-145. doi: 10.1373/clinchem.2018.288332. Epub 2018 Nov 26. PMID: 30478135; PMCID: PMC6345642.
- Lakatta EG. Arterial and cardiac aging: major shareholders in cardiovascular disease enterprises: Part III: cellular and molecular clues to heart and arterial aging. Circulation. 2003 Jan 28;107(3):490-7. doi: 10.1161/01.cir.0000048894.99865.02. PMID: 12551876.
- Kannel WB. Incidence and epidemiology of heart failure. Heart Fail Rev. 2000 Jun;5(2):167-73. doi: 10.1023/A:1009884820941. PMID: 16228142.
- Masoudi FA, Havranek EP, Smith G, Fish RH, Steiner JF, Ordin DL, Krumholz HM. Gender, age, and heart failure with preserved left ventricular systolic function. J Am Coll Cardiol. 2003 Jan 15;41(2):217-23. doi: 10.1016/s0735-1097(02)02696-7. PMID: 12535812.
- Sharma A, Zhao X, Hammill BG, Hernandez AF, Fonarow GC, Felker GM, Yancy CW, Heidenreich PA, Ezekowitz JA, DeVore AD. Trends in Noncardiovascular Comorbidities Among Patients Hospitalized for Heart Failure: Insights From the Get With The Guidelines-Heart Failure Registry. Circ Heart Fail. 2018 Jun;11(6):e004646. doi: 10.1161/CIRCHEARTFAILURE.117.004646. PMID: 29793934.
- Messerli FH, Rimoldi SF, Bangalore S. The Transition From Hypertension to Heart Failure: Contemporary Update. JACC Heart Fail. 2017 Aug;5(8):543-551. doi: 10.1016/j.jchf.2017.04.012. Epub 2017 Jul 12. Erratum in: JACC Heart Fail. 2017 Dec;5(12 ):948. PMID: 28711447.
- Saupe KW, Spindler M, Tian R, Ingwall JS. Impaired cardiac energetics in mice lacking muscle-specific isoenzymes of creatine kinase. Circ Res. 1998 May 4;82(8):898-907. doi: 10.1161/01.res.82.8.898. PMID: 9576109.
- Ingwall JS, Weiss RG. Is the failing heart energy starved? On using chemical energy to support cardiac function. Circ Res. 2004 Jul 23;95(2):135-45. doi: 10.1161/01.RES.0000137170.41939.d9. PMID: 15271865.