
More Information
Submitted: May 25, 2023 | Approved: April 13, 2024 | Published: April 15, 2024
How to cite this article: Camargo VMB, Damatto FC, Fioravante VC, Godoi AR, Stoppa EG, et al. Chronic Ethanol Decreases the Left Ventricular Cardiac Performance. J Cardiol Cardiovasc Med. 2024; 9: 067-072.
DOI: 10.29328/journal.jccm.1001181
Copyright License: © 2024 Camargo VMB, et al. This is an open access article distributed under the Creative Commons Attribution License, which permits unrestricted use, distribution, and reproduction in any medium, provided the original work is properly cited.
Keywords: Heart; Ethanol; Alcoholic cardiomyopathy; Electrocardiogram; Echocardiogram; Stress test

Chronic Ethanol Decreases the Left Ventricular Cardiac Performance
Camargo VMB1*, Damatto FC2, Fioravante VC1, Godoi AR1, Stoppa EG3, Okoshi MP2, Okoshi K2, Miranda JRA3 and Martinez FE1
1Department of Structural and Functional Biology, Institute of Biosciences of Botucatu, UNESP - Paulista State University, Botucatu, SP, Brazil
2Department of Medical Clinic, Botucatu Faculty of Medicine, UNESP - Paulista State University, Botucatu, SP, Brazil
3Department of Biophysics and Pharmacology, Institute of Biosciences of Botucatu, UNESP - Paulista State University, Botucatu, SP, Brazil
*Address for Correspondence: Dr. Camargo VMB, Professor, Department of Structural and Functional Biology, Institute of Biosciences of Botucatu, UNESP - Paulista State University, Brazil Antonio Celso Wagner Zanin, 250, Botucatu, São Palo, Brazil, Email: [email protected]
Introduction: Spaced fiber bundles, less evident cell striations, deposition of collagen fiber bundles, and increased presence of fibroblasts in the cardiac tissue of rats that voluntarily and chronically ingested ethanol were observed by our research group. In addition, we observed increased proliferation and cell death of cardiomyocytes. To find out whether these changes lead to impaired heart functionality, some clinical tests were performed.
Aim: to investigate whether chronic ethanol decreases the left ventricular performance assessed by exercise testing, electrocardiogram, and echocardiogram of male and female UChB strain rats.
Material and methods: ten adult males and ten adult females, Wistar strain rats, named UChB (University of Chile), spontaneous high ethanol drinkers (consumption greater than 2 g ethanol / Kg body weight/day), and ten male UChB rats and ten adults female UChB rats, not exposed to ethanol, UChBC rats (controls) were used. Cardiac performance was evaluated by the stress test, electrocardiogram, and echocardiogram.
Results: Exposed females showed ventricular morphological changes in the heart. The exposed females and males had the highest heart relative weight with females being larger than males. The exposed females showed altered electrocardiogram and echocardiogram.
Conclusion: Chronic ethanol decreases the left ventricular cardiac performance in rats. Females are more sensitive to changes in cardiac electrical conduction.
As the distillates became available and transportation improved, alcoholic beverages became affordable, and accessible in all seasons of the year and usually at any time of the week. This increase in supply and availability proved to be disastrous [1]. Over the centuries, ethanol has become the most socially accepted addictive drug around the world [2], and its harmful use is the main risk factor for death in men aged 15 to 59 years, with evidence that women may be more vulnerable [1]. That female vulnerability is associated with the development of higher concentrations and prolonged levels of ethanol in the blood. This reflects on the interaction of gender differences in various aspects of ethanol metabolism [3]. UChB rats are high drinkers amount of ethanol [5], being considered a suitable experimental model in studies that seek to evaluate the effects of volunteer alcohol consumption, as they have a profile like that of men in society and do not face the force-feeding stress [5].
It is known that the consumption of ethanol can interfere with the integrity and functionality of the heart and impact other organs through different courses of action. Moderate doses, consumed regularly, are sufficient to induce metabolic and physiological changes throughout the body, including structural and functional in the myocardium [6]. Myocytes are highly sensitive to the toxic effects of ethanol, with a low rate of regeneration after cell death [7]. However, mechanisms of repair involving hypertrophy and low regeneration can, to some extent, neutralize the generation of injuries [8]. Eventually, irreversible structural damage occurs [8,9] by apoptosis [10]. The balance between the mechanisms that generate or repair injuries defines the degree and reversibility of the cardiac damage caused [11]. To investigate the physiological integrity and heart functionality, clinical tests such as electrocardiogram, echocardiogram, and stress tests are used.
It is evident that investigations of ethanol on the myocardium of the left ventricle, the engine of the systemic circulatory system, contribute to the elucidation of the mechanisms involved in the completeness, physiology, diagnosis, pathology, and therapy of the heart. Furthermore, they stand out changes between the sexes, since the exposure and metabolism of ethanol are different, with irreversible consequences for health and society.
Our objectives are to investigate whether chronic ethanol decreases the left ventricular cardiac performance assessed by exercise testing, electrocardiogram, and echocardiogram of male and female UChB strain rats.
Experimental design
UChB rats were selected after a period of observation, in which at 65 days of age, they were given two bottles, one containing a 10% ethanol solution and the other water, for free choice, for 15 days. Rats consuming > 2 g of ethanol/kg of body weight/day were considered able to integrate the group exposed to ethanol (UChB). This group totaled 20 rats, 10 males (Me) and 10 females (Fe) with free access to 10% ethanol solution (v/v) and water at will until collection. The control group (UChBC), also with 20 rats, 10 males (Mc) and 10 females (Fc) had access only to water, from weaning to collection. All experiments carried out were approved by the Ethics Committee on the Use of Animals (CEUA Nº 6199280820).
Exercise testing
To evaluate the functional capacity, the rats, after chronic exposure (minimum 100 days) to ethanol, spent a period of adaptation to the test environment in which they were submitted to 10 minutes/day of exercises, with a speed of 5 m/min, on alternate days, for 1 week. On the day of the evaluations, the test consisted of an initial warm-up for 5 min on a treadmill with a speed of 5 m/min. After warming up, the animals were subjected to exercise at an 8 m/min speed, followed by 3 m/min increments every 3 min until exhaustion, determined when the animal refused to run even after electrical stimulation or was unable to coordinate the steps. The maximum speed and operating time were recorded and the total distance was calculated (SOUZA, et al. 2021). Each animal was tested and individually tailored.
Electrocardiogram
To obtain an Electrocardiogram (ECG) record, the animals, after chronic exposure (at least 100 days) to ethanol, were anesthetized with Isoforine® (isoflurane) (4.0% induction and 1.5% maintenance) and kept in a dorsal decubitus. The electrodes were placed in the D2 lead position (the positive electrode on the left lower limb, the negative electrode on the right upper limb, and the reference electrode on the right lower limb). The signal was recorded for fifteen minutes, acquired by the Biopac A/D system (MP100 System; BIOPAC, CA, USA), and connected to the Aknology program. Data were analyzed and processed using the MatLab program (Mathworks, Natick, MA, USA). Figure 1 represents the measurement procedure performed [12].
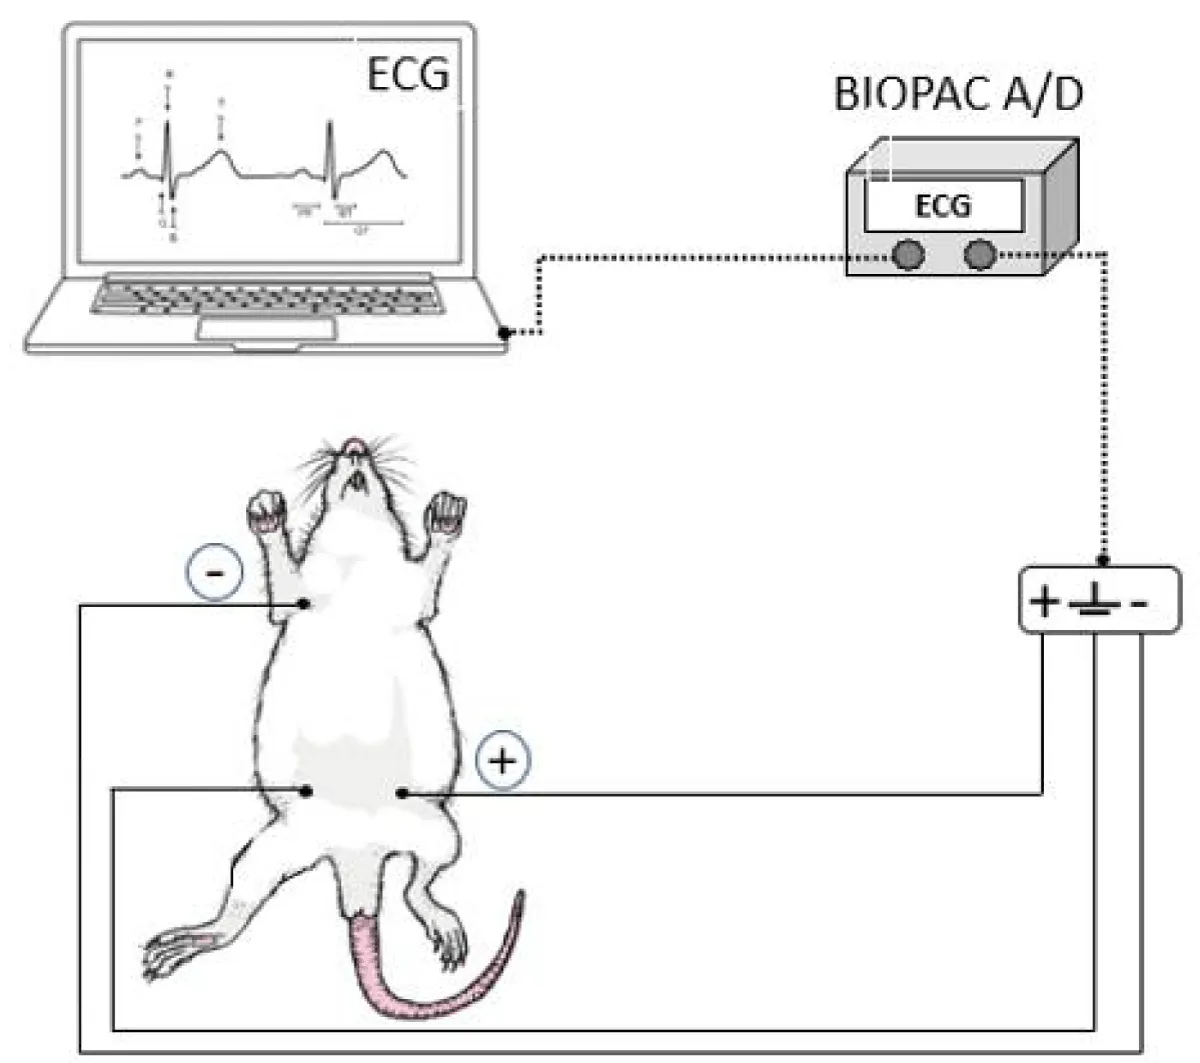
Figure 1: Schematic representation of obtaining the electrocardiogram record (ECG).
After processing the acquired signal, the RR interval, which determines the regularity of repetitions of R waves on the ECG, was analyzed, as well as the QT interval, related to ventricular activity and heart rate (HR) in Beats Per Minute (BPM), evidencing the presence of arrhythmias. Figure 2 illustrates the ECG (D2 lead) and the RR interval analysis for arrhythmias identification.
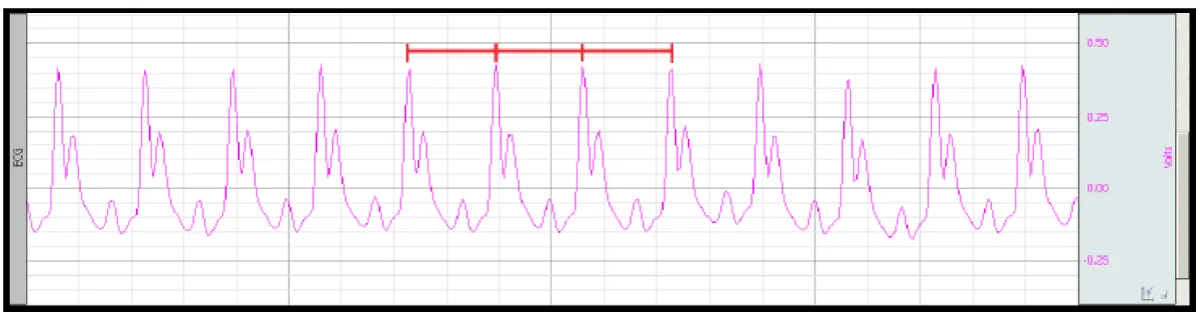
Figure 2: ECG obtained in the D2 lead and the RR interval (red markings) for quantification of arrhythmias [12].
Echocardiogram
Cardiac structure and function were assessed by transthoracic echocardiography, using General Electric Medical Systems equipment, model Vivid S6 (Tirat Carmel, Israel), equipped with a multifrequency transducer from 5 to 11.5 MHz. The rats, after chronic exposure (minimum 100 days) to ethanol, were sedated with ketamine hydrochloride (50 mg/kg) and xylazine hydrochloride (1 mg/kg) intraperitoneal. After trichotomy of the anterior region of the thorax, the animals were placed in left lateral decubitus.
Images were obtained in one-dimensional mode (M-mode) guided by the images in two-dimensional mode, with the transducer in the parasternal position, minor axis. for evaluation of the left ventricle (LV), the M-mode cursor was positioned inferior to the plane of the left atrioventricular valve close to the papillary muscles. The images obtained were registered in a printer, model UP-895 (Sony, Japan), and the cardiac structures were measured, manually, with a caliper (Mitutoyo, Japan). These measurements were: LV diastolic diameters (LVDD) and LV systolic diameters (LVSD), LV posterior wall diastolic thickness (DPWT), and of the interventricular septum (DSWT). LV relative wall thickness (RWT) was calculated with the formula 2 × DPWT/LVDD. Left ventricular mass (LVM) was calculated using the formula [(LVDD + DPWT + DSWT)3− LVDD3] × 1.04. LV mass index (LVMI) was calculated by dividing LVM by body weight.
Systolic function was assessed by the following parameters: Ejection Fraction (EFR) and Posterior Wall Shortening Velocity (PWSV). The diastolic function was analyzed by early and late diastolic mitral inflow velocities (E and A waves), E/A ratio, and E wave deceleration time (EDT). For the joint analysis of LV diastolic and systolic function, the myocardial performance index (Tei) was used.
Statistical analysis
Data normality was evaluated by the Shapiro-Wilk test. The unpaired t-test was used for normal data (parametric) and for non-normal data (non-parametric) the Mann-Whitney test was applied. A p - value < 0.05 was considered significant using GraphPad Prism 8.0 (GraphPad Software, La Jolla, California, United States).
Heart relative weight
By normalizing the total heart weight (mg) by body weight (mg) (cardiac index), we found differences between females (Figure 3A), males (Figure 3B), controls (Figure 3C), and exposed (Figure 3D). The Fe and Me had the highest heart relative weight with Fe being larger than Me.
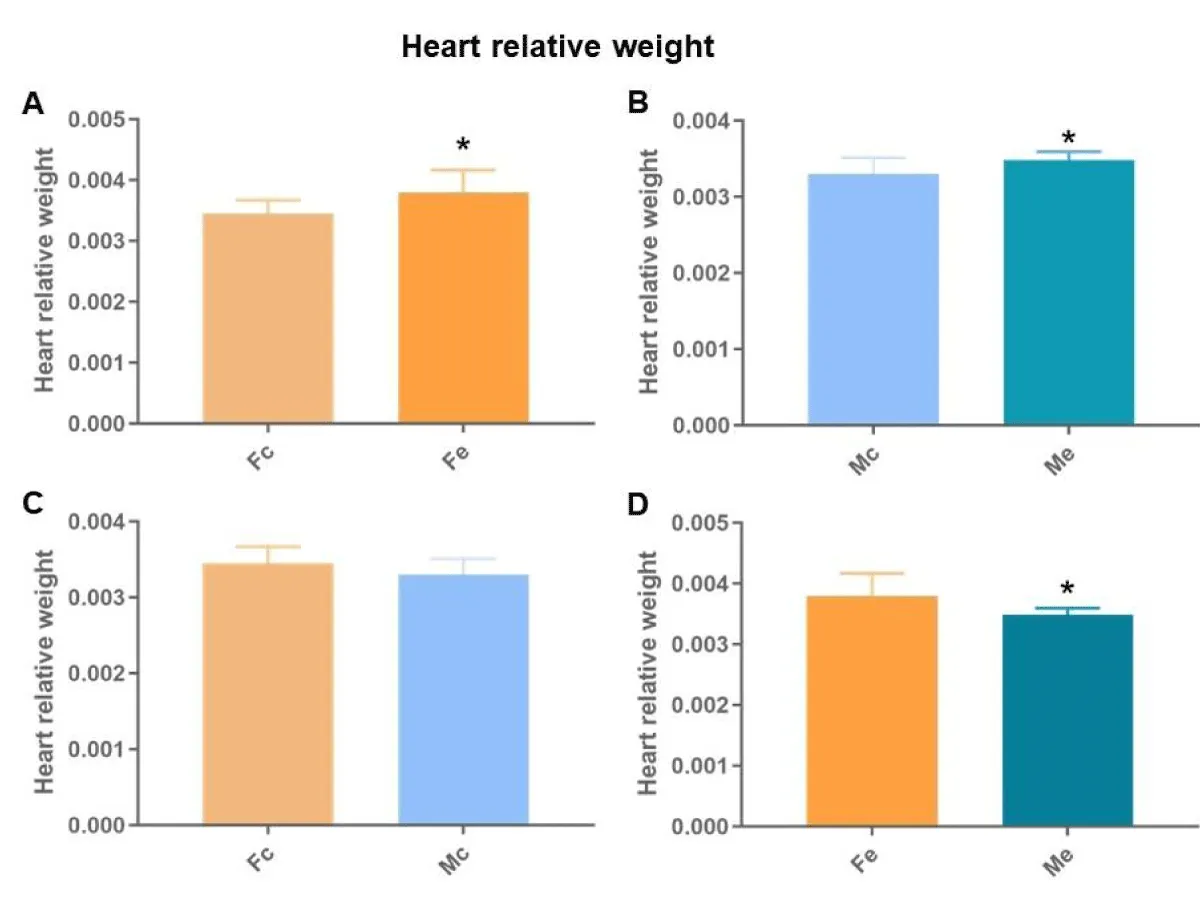
Figure 3: Heart relative weight. A: comparison between females; B: comparison between males; C: comparison between controls; D: comparison between exposed (p < 0.05*).
Exercise testing
The exercise tests showed no difference in the total distances covered (Figure 4), nor in the operating times (Figure 5).
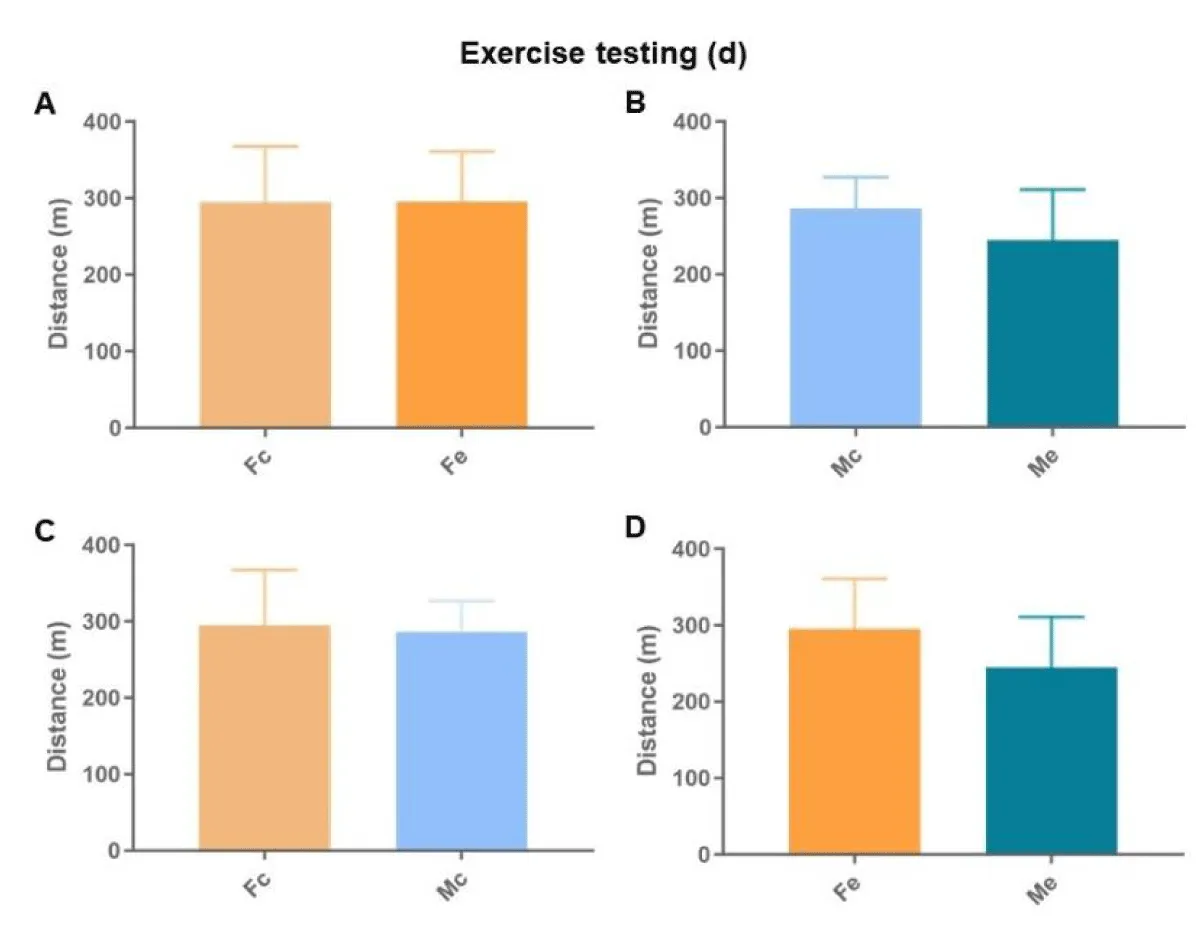
Figure 4: Total distance walked during the exercise testing. A: comparison between females; B: comparison between males; C: comparison between controls; D: comparison between exposed (p < 0.05*).
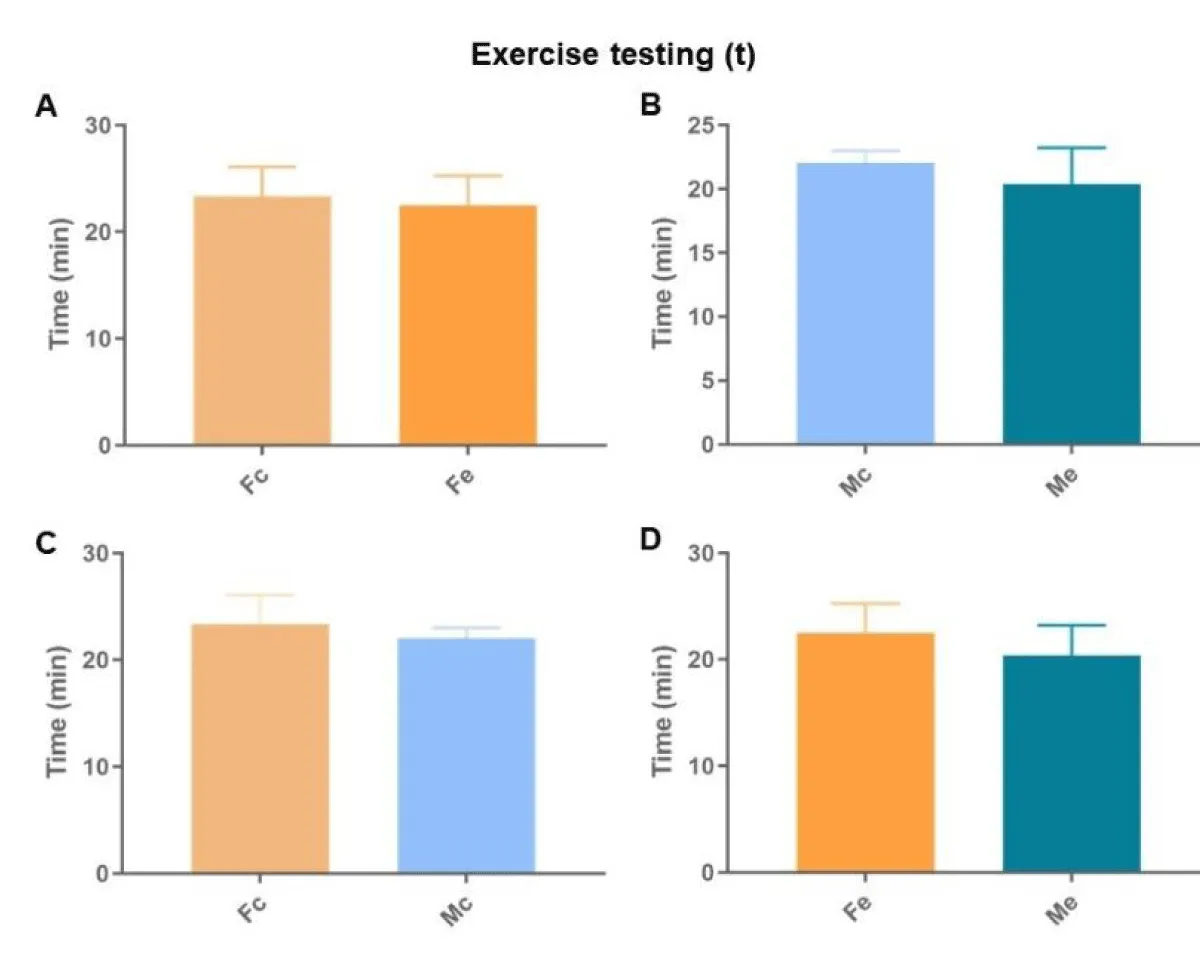
Figure 5: Duration in minutes of the exercise testing. A: comparison between females; B: comparison between males; C: comparison between controls; D: comparison between exposures (p < 0.05*).
Electrocardiogram
We found differences between the Fc and Fe groups in all analyses (Figures 6-8). We also identified differences in the QT interval comparing control groups. There was no difference in the remaining comparisons.
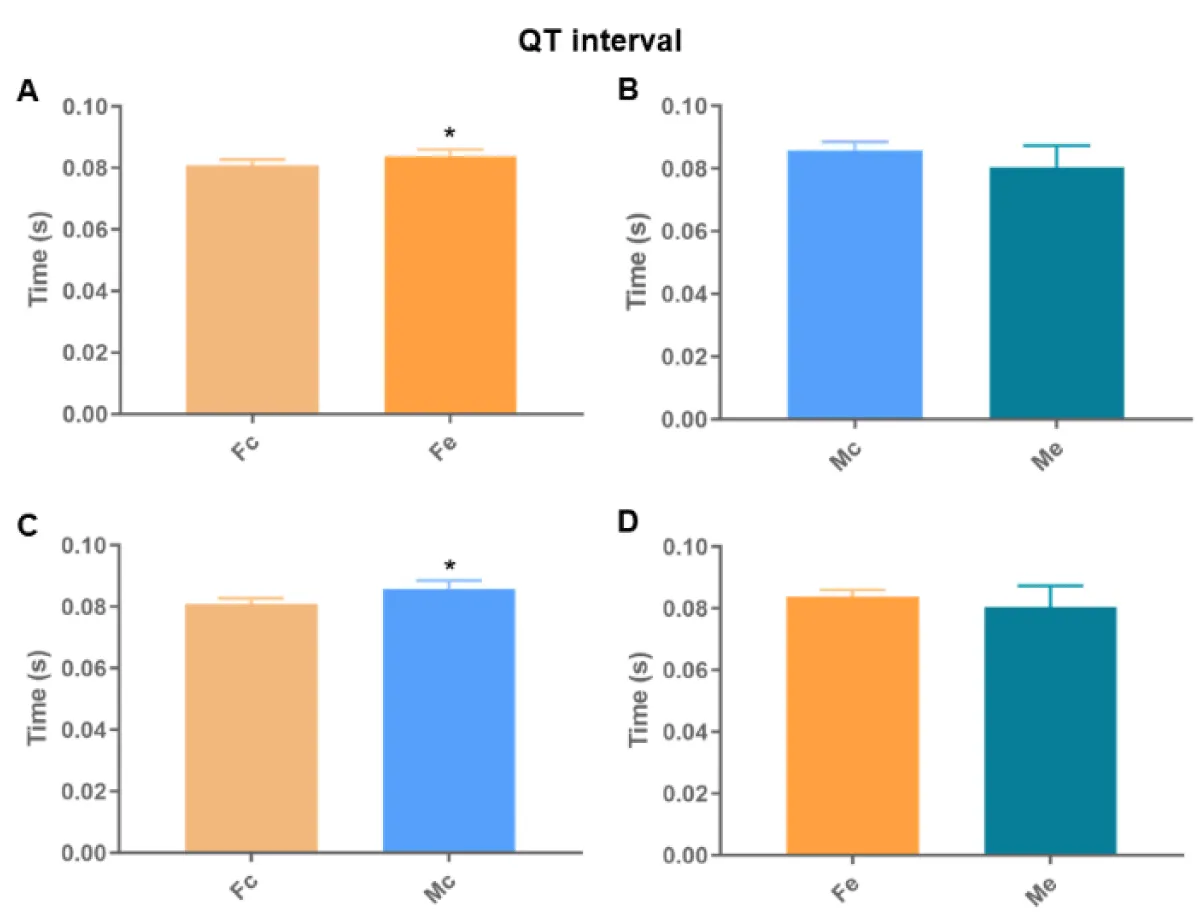
Figure 6: QT interval. A: comparison between females; B: comparison between males; C: comparison between controls; D: comparison among exposed (p < 0.05*).
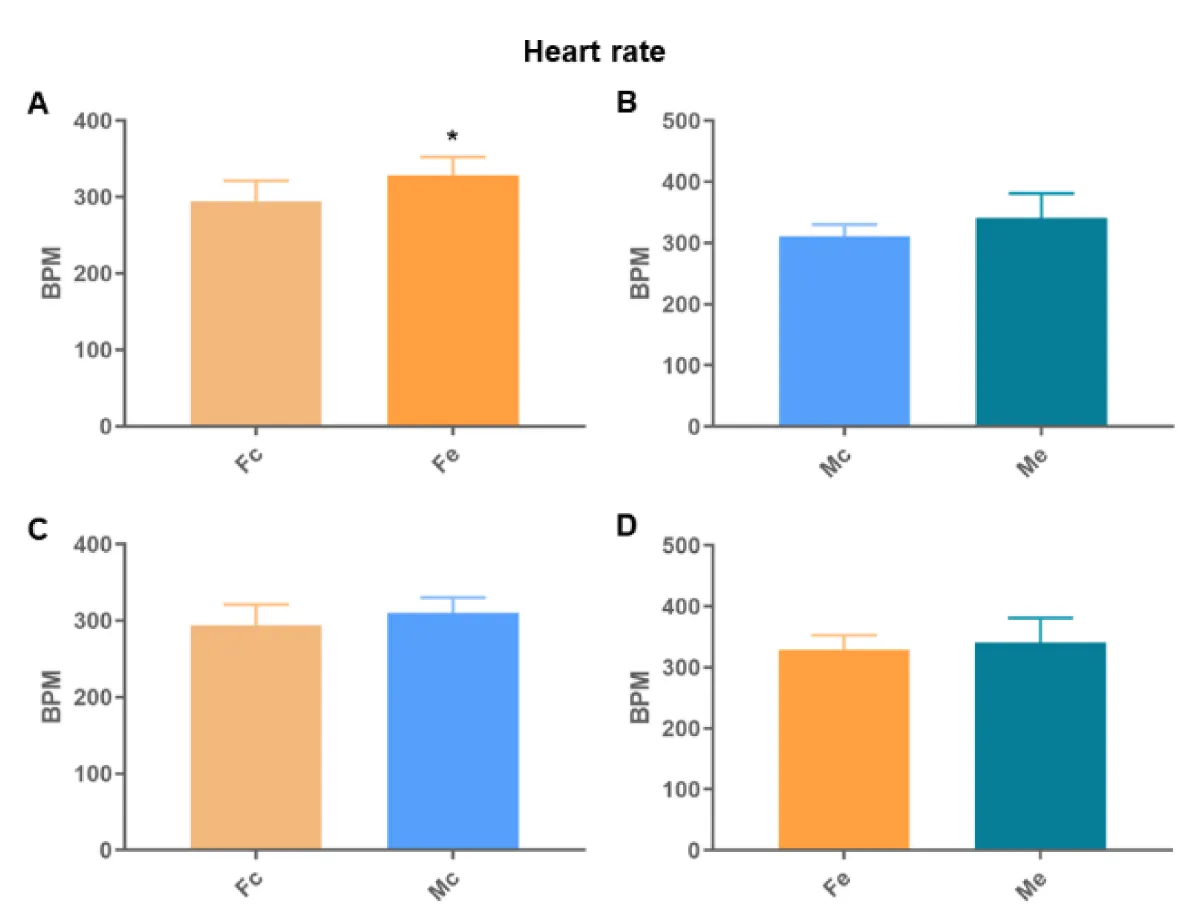
Figure 7: Heart rate. A: comparison between females; B: comparison between males; C: comparison between controls; D: comparison between exposed (p < 0.05*).
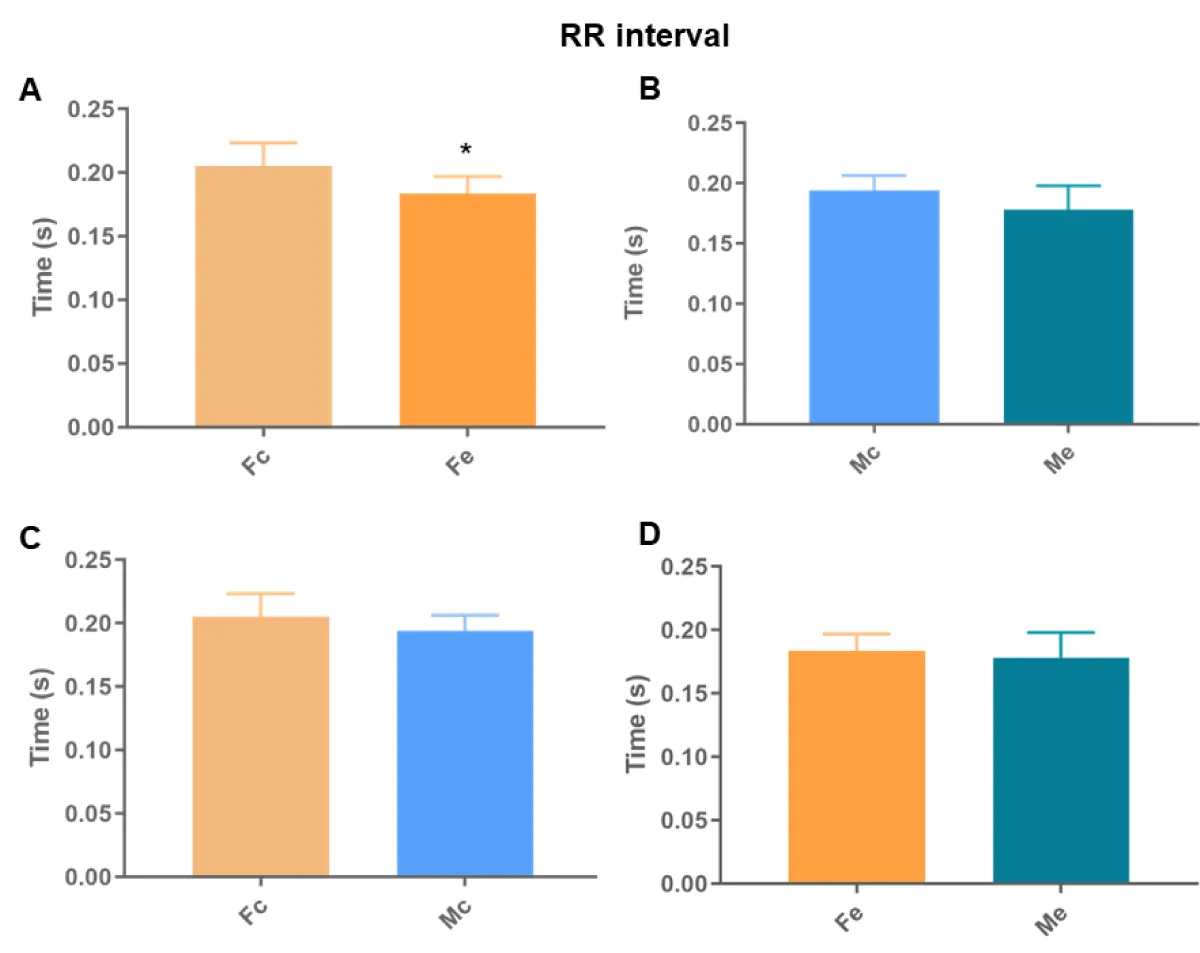
Figure 8: RR interval. A: comparison between females; B: comparison between males; C: comparison between controls; D: comparison between exposures (p < 0.05*).
Echocardiograms
The structural echocardiographic data are listed in Table 1.
| Table 1: Echocardiographic structural data. | |||||
| Me | Mc | Fe | Fc | ||
| LVDD | 7.70 ± 0.51 | 7.87 ± 0.38 | 6.97 ± 0.30« | 6.89 ± 0.22· | |
| LVDS | 3.81 ± 0.53 | 3.78 ± 0.35 | 3.33 ± 0.38« | 3.36 ± 0.31· | |
| DSWT |
|
1.25 ± 0.06 | 1.17 ± 0.07« | 1.16 ± 0.08· | |
| RWT | 0.34 ± 0.01 * | 1.26 ± 0.05 | 1.17 ± 0.07« | 1.17 ± 0.07· | |
| LVM | 0.67 ± 0.10 | 0.32 ± 0.01 | 0.34 ± 0.02 | 0.34 ± 0.03 | |
| LVMI | 1.59 ± 0.15 | 0.66 ± 0.09 | 0.49 ± 0.05 | 0.48 ± 0.05 | |
| Data are expressed as mean ± standard deviation. LVDD: left ventricular diastolic diameters; LVSD: left ventricular systolic diameters; DPWT: left ventricular posterior wall diastolic thickness; DSWT: interventricular septum wall diastolic thickness; RWT: left ventricular relative wall thickness; LVM: left ventricular mass; LVMI: left ventricular mass index. The unpaired t-test was used for normal data (parametric) and for non-normal data (non-parametric) the Mann-Whitney test was applied. A p-value < 0.05 was considered significant (* represents the difference between males; « represents the difference between exposed; · represents the difference between controls). | |||||
Exposed and control females showed the lowest values compared to males, except in LVM and LVMI.
The left ventricular systolic function data are listed in Table 2. Exposed females (Tei) and controls (PWSV) showed the lowest values compared to males.
| Table 2: Echocardiographic parameters of left ventricular systolic function. | ||||
| Me | Mc | Fe | Fc | |
| ERF | 0.88 ± 0.04 | 0.89 ± 0.03 | 0.89 ± 0.03 | 0.88 ± 0.03 |
| PWSV | 36.56 ± 4.90 | 41.27 ± 4.77 | 34.89 ± 4.33 | 36.97 ± 2.42· |
| Tei | 0.55 ± 0.06 | 0.52 ± 0.03 | 0.51 ± 0.05« | 0.53 ± 0.06 |
| Data are expressed as mean ± standard deviation. ERF: ejection fraction; PWSV: posterior wall shortening velocity. The unpaired t-test was used for normal data (parametric) and for non-normal data (non-parametric) the Mann-Whitney test was applied. A p - value < 0.05 was considered significant (« represents the difference between exposed; · represents the difference between controls). | ||||
The left ventricular diastolic function data are listed in Table 3. Control females showed the lowest values compared to exposed females (E and A wave) and control males (E wave). Exposed males showed the lowest values compared to exposed females, except in EDT.
| Table 3: Echocardiographic parameters of left ventricular diastolic function. | ||||
| Me | Mc | Fe | Fc | |
| E wave | 66.20 ± 6.98« | 71.71 ± 8.54 | 71.70 ± 6.75 | 64.00 ± 5.60#· |
| A wave | 40.40 ± 13.39« | 42.57 ± 11.09 | 49.00 ± 8.21 | 42.30 ± 5.62# |
| E/A | 1.75 ± 0.42« | 1.77 ± 0.45 | 1.48 ± 0.16 | 1.53 ± 0.20 |
| EDT | 57.40 ± 8.41 | 52.71 ± 3.25 | 57.10 ± 11.68 | 53.40 ± 6.26 |
| Data are expressed as mean ± standard deviation. E wave: early diastolic mitral inflow velocities; A wave: late diastolic mitral inflow velocities; EST: E wave deceleration time. The unpaired t-test was used for normal data (parametric) and for non-normal data (non-parametric) the Mann-Whitney test was applied. A p - value < 0.05 was considered significant (# represents the difference between females; « represents the difference between exposed; · represents the difference between controls). | ||||
Chronic ethanol leads to an increase in heart relative weight in exposed males and females, with a greater increase in females, which have a greater risk of mortality associated with increased left ventricular mass than males [13], and are more sensitive to the action of ethanol. There was no difference in the exercise testing. We found differences between the Fc and Fe groups in all electrocardiographic analyses, identifying a longer QT interval, higher HR, and shorter RR interval in the exposed ones. We also identified differences in the QT interval between the control groups. In the echocardiograms, the exposed and control females showed the lowest values compared to males, except in LVM and LVMI. In the left ventricular systolic function, the exposed females (Tei) and controls (PWSV) showed the lowest values compared to males. In the left ventricular diastolic function, control females showed the lowest values compared to exposed females (E and A wave) and control males (E wave). Exposed males showed the lowest values compared to exposed females, except in EDT.
The increase in the heart is the result of the cardiac remodeling process that includes changes associated with heart failure [14]. Cardiac remodeling involves molecular, cellular, and interstitial changes that manifest clinically through changes in the size, shape, and function of the heart after injury. This process is influenced by the hemodynamic load and neurohormonal activation, with cardiomyocytes as the principal cells involved. From the stretching of the cardiac fibers, there is an increase in the activity of local norepinephrine, in the release of angiotensin and endothelin, resulting in the expression of altered proteins and cardiomyocyte hypertrophy. Hypertrophy causes an increase in neuronal activation and deterioration in cardiac performance [14].
Cardiac autonomic dysregulation is central to the development and progression of most cardiovascular diseases (hypertension, heart failure, arrhythmias, and infarction) [15]. Heart disease disrupts not only the muscle but also the cardiac nervous system [16], which is strongly linked to the electrical regulation of the heart. Among many of the effects of ethanol on the heart is the implication on cardiac rhythm and arrhythmias [17]. We found differences between the Fc and Fe groups in all electrocardiographic analyses, identifying a longer QT interval, higher HR, and shorter RR interval in the exposed ones. We also identified differences in the QT interval between the control groups, proving the theory of sexual difference [9,18,19]. Thus, the increase detected in Fe proves changes in ventricular depolarization and repolarization. Thus, the finding that Fe has a shorter RR interval than Fc corroborates that arrhythmias in chronic alcoholics may represent clinical manifestations of dilated cardiomyopathy, because of electrolyte abnormalities [17].
The echocardiograms of the Me showed an increase in the diastolic thickness of the posterior wall of the LV (DPWT), in the diastolic thickness of the interventricular septum (DSWT), and relative thickness of the LV (RWT). This increase characterizes concentric remodeling of the left ventricular geometry (ANGELAKI, et al. 2021). Among the controls, the echocardiograms showed differences in diastolic diameter (LVDD), LV systolic diameter (LVSD), LV posterior wall diastolic thickness (DPWT), interventricular septal diastolic thickness (DSWT), LV relative thickness (RWT) and velocity of posterior wall shortening (PWSV). All these values are higher in Mc compared to Fc. This result represents the difference in body weight between males and females. Females weigh an average of 150 g less than males. Thus, the cutoff points to identify left ventricular hypertrophy are different between genders [20].
The echocardiograms of the Me were greater in the variables: diastolic diameter (LVDD), systolic diameter (LVDS), diastolic interventricular septal thickness (DSWT), and myocardial performance index (Tei) about Fe. In addition, a lower LV mass index (LVMI) was found in males. These results point to structural, biochemical, and functional differences in the hearts of males and females of the same age [21], in addition to being related to the difference in body weight and heart weight, which are greater in males [22-24]. However, the ratio of heart to body weight is greater in women [25-31].
In conclusion, chronic ethanol decreases the left ventricular cardiac performance in rats. Females are more sensitive to changes in cardiac electrical conduction.
Funder
This study was financed in part by the Coordenação de Aperfeiçoamento de Pessoal de Nível Superior – Brasil (CAPES) – Finance Code 3300406-4.
Data availability declaration
There are no legal or ethical reasons for sharing data, just the guarantee of intellectual property. The data preservation and sharing policy will be authorized after the publication of conclusions in indexed journals in the area and data storage will be made available and accessible in repositories and services at our institution, Universidade Estadual Paulista Júlio de Mesquita Filho (UNESP, https://repositorio.unesp.br/).
- WORLD Health Organization. Global status report on alcohol and health 2014 ed. World Health Organization. Geneva, Switzerland. 2014.
- Carnevale R, Nocella C. Alcohol and cardiovascular disease: still unresolved underlying mechanisms. Vascul Pharmacol. 2012 Sep-Oct;57(2-4):69-71. doi: 10.1016/j.vph.2012.06.005. Epub 2012 Jul 4. PMID: 22796018.
- Baraona E, Abittan CS, Dohmen K, Moretti M, Pozzato G, Chayes ZW, Schaefer C, Lieber CS. Gender differences in pharmacokinetics of alcohol. Alcohol Clin Exp Res. 2001 Apr;25(4):502-7. PMID: 11329488.
- Mardones J, Segovia-Riquelme N. Thirty-two years of selection of rats by ethanol preference: UChA and UChB strains. Neurobehav Toxicol Teratol. 1983 Mar-Apr;5(2):171-8. PMID: 6683362.
- Gapp K, Jawaid A, Sarkies P, Bohacek J, Pelczar P, Prados J, Farinelli L, Miska E, Mansuy IM. Implication of sperm RNAs in transgenerational inheritance of the effects of early trauma in mice. Nat Neurosci. 2014 May;17(5):667-9. doi: 10.1038/nn.3695. Epub 2014 Apr 13. PMID: 24728267; PMCID: PMC4333222.
- Brandt M, Wenzel P. Alcohol puts the heart under pressure: Acetaldehyde activates a localized renin angiotensin aldosterone system within the myocardium in alcoholic cardiomyopathy. Int J Cardiol. 2018 Apr 15;257:220-221. doi: 10.1016/j.ijcard.2018.01.037. PMID: 29506696.
- Krenz M, Korthuis RJ. Moderate ethanol ingestion and cardiovascular protection: from epidemiologic associations to cellular mechanisms. J Mol Cell Cardiol. 2012 Jan;52(1):93-104. doi: 10.1016/j.yjmcc.2011.10.011. Epub 2011 Oct 23. PMID: 22041278; PMCID: PMC3246046.
- Vaideeswar P, Chaudhari C, Rane S, Gondhalekar J, Dandekar S. Cardiac pathology in chronic alcoholics: a preliminary study. J Postgrad Med. 2014 Oct-Dec;60(4):372-6. doi: 10.4103/0022-3859.143958. PMID: 25370544.
- Urbano-Márquez A, Estruch R, Fernández-Solá J, Nicolás JM, Paré JC, Rubin E. The greater risk of alcoholic cardiomyopathy and myopathy in women compared with men. JAMA. 1995 Jul 12;274(2):149-54. doi: 10.1001/jama.1995.03530020067034. PMID: 7596003.
- Fernandezsola J. Evidence of apoptosis in alcoholic cardiomyopathy☆. Human Pathology. 2006; 37:8; 1100–1110.
- Fernández-Solà J. Cardiovascular risks and benefits of moderate and heavy alcohol consumption. Nat Rev Cardiol. 2015 Oct;12(10):576-87. doi: 10.1038/nrcardio.2015.91. Epub 2015 Jun 23. PMID: 26099843.
- Próspero AG, Quini CC, Bakuzis AF, Fidelis-de-Oliveira P, Moretto GM, Mello FP, Calabresi MF, Matos RV, Zandoná EA, Zufelato N, Oliveira RB, Miranda JR. Real-time in vivo monitoring of magnetic nanoparticles in the bloodstream by AC biosusceptometry. J Nanobiotechnology. 2017 Mar 21;15(1):22. doi: 10.1186/s12951-017-0257-6. PMID: 28327191; PMCID: PMC5361818.
- Liao Y, Cooper RS, Mensah GA, McGee DL. Left ventricular hypertrophy has a greater impact on survival in women than in men. Circulation. 1995 Aug 15;92(4):805-10. doi: 10.1161/01.cir.92.4.805. PMID: 7641360.
- Cohn JN, Ferrari R, Sharpe N. Cardiac remodeling--concepts and clinical implications: a consensus paper from an international forum on cardiac remodeling. Behalf of an International Forum on Cardiac Remodeling. J Am Coll Cardiol. 2000 Mar 1;35(3):569-82. doi: 10.1016/s0735-1097(99)00630-0. PMID: 10716457.
- Fukuda K, Kanazawa H, Aizawa Y, Ardell JL, Shivkumar K. Cardiac innervation and sudden cardiac death. Circ Res. 2015 Jun 5;116(12):2005-19. doi: 10.1161/CIRCRESAHA.116.304679. PMID: 26044253; PMCID: PMC4465108.
- Chan SA, Vaseghi M, Kluge N, Shivkumar K, Ardell JL, Smith C. Fast in vivo detection of myocardial norepinephrine levels in the beating porcine heart. Am J Physiol Heart Circ Physiol. 2020 May 1;318(5):H1091-H1099. doi: 10.1152/ajpheart.00574.2019. Epub 2020 Mar 27. PMID: 32216617; PMCID: PMC7346543.
- George A, Figueredo VM. Alcohol and arrhythmias: a comprehensive review. J Cardiovasc Med (Hagerstown). 2010 Apr;11(4):221-8. doi: 10.2459/JCM.0b013e328334b42d. PMID: 19923999.
- Fei L, Statters DJ, Camm AJ. QT-interval dispersion on 12-lead electrocardiogram in normal subjects: its reproducibility and relation to the T wave. Am Heart J. 1994 Jun;127(6):1654-5. doi: 10.1016/0002-8703(94)90409-x. PMID: 8198006.
- Rautaharju PM, Surawicz B, Gettes LS. AHA/ACCF/HRS Recommendations for the Standardization and Interpretation of the Electrocardiogram. Journal of the American College of Cardiology.2009; 53:11; 982–991.
- Krumholz HM, Larson M, Levy D. Prognosis of left ventricular geometric patterns in the Framingham Heart Study. J Am Coll Cardiol. 1995 Mar 15;25(4):879-84. doi: 10.1016/0735-1097(94)00473-4. PMID: 7884091.
- Capasso JM, Remily RM, Smith RH, Sonnenblick EH. Sex differences in myocardial contractility in the rat. Basic Res Cardiol. 1983 Mar-Apr;78(2):156-71. doi: 10.1007/BF01906669. PMID: 6870744.
- Shreiner DP, Weisfeldt ML, Shock NW. Effects of age, sex, and breeding status on the rat heart. Am J Physiol. 1969 Jul;217(1):176-80. doi: 10.1152/ajplegacy.1969.217.1.176. PMID: 5785875.
- Wolinsky H. Effects of hypertension and its reversal on the thoracic aorta of male and female rats. Morphological and chemical studies. Circ Res. 1971 Jun;28(6):622-37. doi: 10.1161/01.res.28.6.622. PMID: 5087325.
- Dadgar SK, Tyagi SP, Singh RP, Hameed S. Factors influencing the normal heart weight--a study of 140 hearts. Jpn Circ J. 1979 Feb;43(2):77-82. doi: 10.1253/jcj.43.77. PMID: 449022.
- BERG BN, HARMISON CR. Blood pressure and heart size in aging rats. J Gerontol. 1955 Oct;10(4):416-9. doi: 10.1093/geronj/10.4.416. PMID: 13263543.
- Hall JE. Guyton & Hall Physiology Review E-Book. 2. ed. [s.l.] Saunders. 2011.
- Kiechl S, Willeit J. Complex association between alcohol consumption and myocardial infarction: always good for a new paradox. Circulation. 2014 Jul 29;130(5):383-6. doi: 10.1161/CIRCULATIONAHA.114.011036. Epub 2014 Jun 13. PMID: 24928683.
- Lanng AR, Gasbjerg LS, Bergmann NC, Gillum MP, Rehfeld JF, Helsted MM, Møller HJ, Grønbæk H, Vilsbøll T, Knop FK. The effect of acute intragastric vs. intravenous alcohol administration on inflammation markers, blood lipids and gallbladder motility in healthy men. Alcohol. 2020 Sep;87:29-37. doi: 10.1016/j.alcohol.2020.04.006. Epub 2020 Apr 23. PMID: 32335270.
- Maetinez F. Injury caused by alcoholic cardiomyopathy in volunteer ethanol drinkers rats. Alcoholism: Clinical and Experimental Research. 2020; 44:48A.
- Pettee Gabriel K, Whitaker KM, Duprez D, Sternfeld B, Lewis CE, Sidney S, Knell G, Jacobs DR Jr. Clinical importance of non-participation in a maximal graded exercise test on risk of non-fatal and fatal cardiovascular events and all-cause mortality: CARDIA study. Prev Med. 2018 Jan;106:137-144. doi: 10.1016/j.ypmed.2017.10.025. Epub 2017 Nov 2. PMID: 29080827; PMCID: PMC6400469.
- Ruan Y, Guo Y, Zheng Y, Huang Z, Sun S, Kowal P, Shi Y, Wu F. Cardiovascular disease (CVD) and associated risk factors among older adults in six low-and middle-income countries: results from SAGE Wave 1. BMC Public Health. 2018 Jun 20;18(1):778. doi: 10.1186/s12889-018-5653-9. PMID: 29925336; PMCID: PMC6011508.