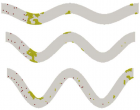
Figure 8
Numerical Simulation of Thrombotic Occlusion in Tortuous Arterioles
Zhi-Gang Feng*, Miguel Cortina, Jennifer KW Chesnutt and Hai-Chao Han*
Published: 06 December, 2017 | Volume 2 - Issue 1 | Pages: 095-111
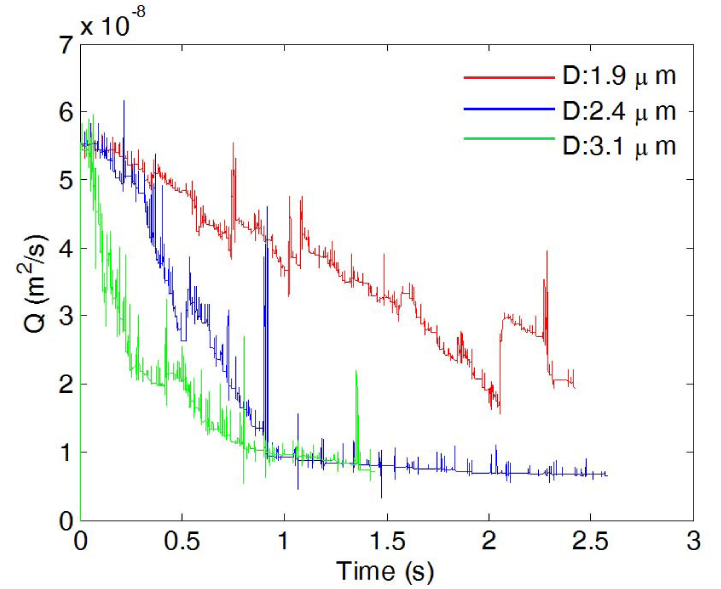
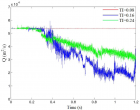
Figure 8:
Flow rate plotted as a function of time during thrombus development for three platelet diameters.
Read Full Article HTML DOI: 10.29328/journal.jccm.1001019 Cite this Article Read Full Article PDF
More Images
Similar Articles
-
Concentration Polarization of Ox-LDL and Its Effect on Cell Proliferation and Apoptosis in Human Endothelial CellsShijie Liu*,Jawahar L Mehta,Yubo Fan,Xiaoyan Deng,Zufeng Ding*. Concentration Polarization of Ox-LDL and Its Effect on Cell Proliferation and Apoptosis in Human Endothelial Cells. . 2016 doi: 10.29328/journal.jccm.1001003; 1:
-
Short and Medium-Term Evaluation of Patients in Coronary Post-Angioplasty: Préliminary results at the Cardiology Department of the Hospital University Aristide Le Dantec of Dakar (Senegal): Study on 38 CasesDioum M*,Aw F,Masmoudi K,Gaye ND,Sarr SA,Ndao SCT, Mingou J,Ngaidé AA,Diack B,Bodian M,Ndiaye MB,Diao M,Ba SA. Short and Medium-Term Evaluation of Patients in Coronary Post-Angioplasty: Préliminary results at the Cardiology Department of the Hospital University Aristide Le Dantec of Dakar (Senegal): Study on 38 Cases. . 2017 doi: 10.29328/journal.jccm.1001006; 2: 008-012
-
Spontaneous rupture of a giant Coronary Artery Aneurysm after acute Myocardial InfarctionOğuzhan Çelik,Mucahit Yetim,Tolga Doğan,Lütfü Bekar,Macit Kalçık*,Yusuf Karavelioğlu. Spontaneous rupture of a giant Coronary Artery Aneurysm after acute Myocardial Infarction. . 2017 doi: 10.29328/journal.jccm.1001009; 2: 026-028
-
Numerical Simulation of Thrombotic Occlusion in Tortuous ArteriolesZhi-Gang Feng*,Miguel Cortina,Jennifer KW Chesnutt,Hai-Chao Han*. Numerical Simulation of Thrombotic Occlusion in Tortuous Arterioles. . 2017 doi: 10.29328/journal.jccm.1001019; 2: 095-111
-
Hyperkalemia: An archenemy in emergency medicine. Description of two case reportsC Naclerio*,A Del Gatto,A Cavallera. Hyperkalemia: An archenemy in emergency medicine. Description of two case reports. . 2018 doi: 10.29328/journal.jccm.1001029; 3: 079-083
-
Clinical relevance linked to echocardiography diagnosis in Bland, White and Garland syndromeMariela Céspedes Almira*,Adel Eladio González Morejón,Giselle Serrano Ricardo,Tania Rosa González Rodríguez. Clinical relevance linked to echocardiography diagnosis in Bland, White and Garland syndrome. . 2020 doi: 10.29328/journal.jccm.1001086; 5: 051-055
-
Dapt ReviewKARACA Özkan*,KARASU Mehdi,KOBAT Mehmet A,KIVRAK Tarık. Dapt Review. . 2020 doi: 10.29328/journal.jccm.1001088; 5: 060-066
-
Femoral venous closure: A single-centre retrospective analysis in real world all comers with MynxGrip® vascular closure deviceNadim Malik*,Alexander Harvard,Shamin Thirunavukarasu,Afzal Hayat,Abid Ullah,Reza Aghamohammadzadeh,Cathy Mary Holt. Femoral venous closure: A single-centre retrospective analysis in real world all comers with MynxGrip® vascular closure device. . 2020 doi: 10.29328/journal.jccm.1001100; 5: 136-140
-
Incidence and outcome of no flow after primary percutaneous coronary intervention in acute myocardial infarctionGoutam Datta*. Incidence and outcome of no flow after primary percutaneous coronary intervention in acute myocardial infarction. . 2020 doi: 10.29328/journal.jccm.1001102; 5: 153-156
-
Post-extrasystolic potentiation differentiates “true” from “pseudo” Low-flow, Low-gradient aortic stenosisMarc Vanderheyden*,Sofie Verstreken,Marc Goethals. Post-extrasystolic potentiation differentiates “true” from “pseudo” Low-flow, Low-gradient aortic stenosis. . 2020 doi: 10.29328/journal.jccm.1001105; 5: 172-173
Recently Viewed
-
A study on the determination of sex using lip print patterns among indigenes of Akwa Ibom State, NigeriaObosi NJ*,Akpantah AO,Archibong VB,Duru GO. A study on the determination of sex using lip print patterns among indigenes of Akwa Ibom State, Nigeria. J Forensic Sci Res. 2022: doi: 10.29328/journal.jfsr.1001032; 6: 017-023
-
The Effect of Humidity on Blood Serum Pattern Formation and Blood TransferKelly P Kearse*. The Effect of Humidity on Blood Serum Pattern Formation and Blood Transfer. J Forensic Sci Res. 2023: doi: 10.29328/journal.jfsr.1001048; 7: 040-048.
-
Variation in Genuine Handwriting While Writing on an Unusual SurfaceNisha Potle, Sakshi Hemant Chavan, Yash Hari Kekane, Snehal Umesh Tembhurne, Nitin Pandey*, Yash Ranjeet dalvi. Variation in Genuine Handwriting While Writing on an Unusual Surface. J Forensic Sci Res. 2023: doi: 10.29328/journal.jfsr.1001046; 7: 025-033
-
Proportion of Risk of Stroke among Male Patients Attending Outpatient Department of a Tertiary Care Hospital, Ernakulam District, KeralaBetcy George*, Susan Mathai, Ansha Mol Shaji, Christy Elsa Abraham, Jisna Johnson. Proportion of Risk of Stroke among Male Patients Attending Outpatient Department of a Tertiary Care Hospital, Ernakulam District, Kerala. Clin J Nurs Care Pract. 2024: doi: 10.29328/journal.cjncp.1001054; 8: 031-035
-
Rare Presentation of Chromoblastomycosis Due to Multiple Simultaneous Inoculations: A Case ReportWalter Belda Jr*, Luiz Felipe Passero. Rare Presentation of Chromoblastomycosis Due to Multiple Simultaneous Inoculations: A Case Report. Ann Dermatol Res. 2023: doi: 10.29328/journal.adr.1001028; 7: 032-035
Most Viewed
-
Evaluation of Biostimulants Based on Recovered Protein Hydrolysates from Animal By-products as Plant Growth EnhancersH Pérez-Aguilar*, M Lacruz-Asaro, F Arán-Ais. Evaluation of Biostimulants Based on Recovered Protein Hydrolysates from Animal By-products as Plant Growth Enhancers. J Plant Sci Phytopathol. 2023 doi: 10.29328/journal.jpsp.1001104; 7: 042-047
-
Feasibility study of magnetic sensing for detecting single-neuron action potentialsDenis Tonini,Kai Wu,Renata Saha,Jian-Ping Wang*. Feasibility study of magnetic sensing for detecting single-neuron action potentials. Ann Biomed Sci Eng. 2022 doi: 10.29328/journal.abse.1001018; 6: 019-029
-
Physical activity can change the physiological and psychological circumstances during COVID-19 pandemic: A narrative reviewKhashayar Maroufi*. Physical activity can change the physiological and psychological circumstances during COVID-19 pandemic: A narrative review. J Sports Med Ther. 2021 doi: 10.29328/journal.jsmt.1001051; 6: 001-007
-
Pediatric Dysgerminoma: Unveiling a Rare Ovarian TumorFaten Limaiem*, Khalil Saffar, Ahmed Halouani. Pediatric Dysgerminoma: Unveiling a Rare Ovarian Tumor. Arch Case Rep. 2024 doi: 10.29328/journal.acr.1001087; 8: 010-013
-
Prospective Coronavirus Liver Effects: Available KnowledgeAvishek Mandal*. Prospective Coronavirus Liver Effects: Available Knowledge. Ann Clin Gastroenterol Hepatol. 2023 doi: 10.29328/journal.acgh.1001039; 7: 001-010

HSPI: We're glad you're here. Please click "create a new Query" if you are a new visitor to our website and need further information from us.
If you are already a member of our network and need to keep track of any developments regarding a question you have already submitted, click "take me to my Query."


