
More Information
Submitted: March 18, 2025 | Approved: March 25, 2025 | Published: March 26, 2025
How to cite this article: Swetha Prthima A, Suresh Kumar JN, Baji S, Venkata Suseela A, Venkata Rupesh G, Bharath Kumar Raju H, et al.
A Prospective Observational Study on Acute Coronary Syndrome: Exploring Knowledge, Attitude and Practice Gaps in Women Regarding Symptoms, Risk Factors and Treatment Options. J Cardiol Cardiovasc Med. 2025; 10(2): 041-048. Available from:
https://dx.doi.org/10.29328/journal.jccm.1001208
DOI: 10.29328/journal.jccm.1001208
Copyright license: © 2025 Swetha Prthima A, et al. This is an open access article distributed under the Creative Commons Attribution License, which permits unrestricted use, distribution, and reproduction in any medium, provided the original work is properly cited.

A Prospective Observational Study on Acute Coronary Syndrome: Exploring Knowledge, Attitude and Practice Gaps in Women Regarding Symptoms, Risk Factors and Treatment Options
A Swetha Prthima1*, JN Suresh Kumar2, S Baji3, A Venkata Suseela1, G Venkata Rupesh1, H Bharath Kumar Raju1 and SK Sabiha Sultana1
1Department of Pharmacy Practice, Narasaraopeta Institute of Pharmaceutical Sciences, Narasaraopet, Palnadu (Dt), Andhra Pradesh 522601, India
2Department of Pharmaceutics, Narasaraopeta Institute of Pharmaceutical Sciences, Narasaraopet, Palnadu (Dt), Andhra Pradesh 522601, India
3Cardiologist Surgeon Vivekananda Super Speciality Hospital, Narasaraopet. Palnadu (Dt), Andhra Pradesh, 522601, India
*Address for Correspondence: Dr. A Swetha Prthima, Pharm D, Associate Professor, Department of Pharmacy Practice, Narasaraopeta Institute of Pharmaceutical Sciences, Narasaraopet, Palnadu (Dt), Andhra Pradesh 522601, India, Email: [email protected]
Acute Coronary Syndrome (ACS) remains a significant global health issue, disproportionately affecting women due to delayed recognition, misdiagnosis, and under-treatment. This study aims to assess the knowledge, attitude, and practice (KAP) gaps in women regarding ACS symptoms, risk factors, and treatment. Conducted as a six-month prospective observational study at Vivekananda Super Speciality Hospital, 170 women diagnosed with ACS participated. The results highlighted that hypertension and diabetes were the most common risk factors, while chest pain was the predominant symptom. Initial assessments showed that most participants had average knowledge (53%), while 51% had poor overall KAP scores. However, post-intervention follow-up demonstrated substantial improvements, with good knowledge increasing from 13% to 36% and good KAP scores rising from 3.6% to 37.7%. Quality of Life (QOL) scores also improved significantly. These findings underscore the need for targeted educational initiatives and gender-sensitive approaches to ACS diagnosis and management. Addressing Yentl Syndrome and enhancing awareness could reduce ACS-related morbidity and mortality in women.
Acute Coronary Syndrome (ACS) is a major global health concern and remains a leading cause of morbidity and mortality among women worldwide [1]. ACS encompasses unstable angina, non-ST-elevation myocardial infarction (NSTEMI), and ST-elevation myocardial infarction (STEMI), all resulting from a sudden reduction in coronary blood flow due to atherosclerotic plaque rupture, thrombus formation, or coronary vasospasm [2,3]. Despite advancements in diagnosis and treatment, women remain disproportionately affected due to delayed recognition, misdiagnosis, and undertreatment [4].
Gender-specific differences in acs presentation and risk factors
Historically, cardiovascular research has been predominantly male-centered, leading to an incomplete understanding of how ACS manifests in women [4]. While men typically present with classic chest pain, women often exhibit atypical symptoms such as nausea, shortness of breath, dizziness, profound fatigue, and pain in the jaw, neck, or back [5,6]. These non-traditional symptoms contribute to delays in seeking medical attention, misdiagnosis, and suboptimal treatment, increasing the risk of adverse cardiovascular events [7,8].
ACS in women is influenced by both traditional and unique risk factors. Established risk factors include hypertension, diabetes, dyslipidemia, obesity, smoking, and physical inactivity [9,10]. However, women also experience hormonal fluctuations, pregnancy-related complications (preeclampsia, gestational diabetes), and postmenopausal estrogen decline, which accelerate vascular dysfunction and plaque instability [11,12]. Additionally, psychosocial stressors, socioeconomic disparities, and limited healthcare access further exacerbate gender-based disparities in cardiovascular health [13-15].
Challenges in ACS diagnosis and the impact of yentl syndrome
One of the key barriers to ACS management in women is the underutilization of evidence-based therapies [4]. Women are less likely to receive timely diagnostic interventions, including electrocardiograms (ECG), cardiac biomarkers (troponins, CK-MB), and coronary angiography, leading to missed or delayed diagnoses [16]. Additionally, they are less likely to undergo primary reperfusion therapy, coronary artery bypass grafting (CABG), or percutaneous coronary intervention (PCI), even when presenting with high-risk features [17].
This disparity is largely attributed to “Yentl Syndrome,” a term describing gender bias in cardiovascular medicine, where women are treated less aggressively unless they present with symptoms similar to men [18]. Consequently, women with ACS experience higher hospital readmission rates, increased in-hospital mortality, and long-term cardiovascular complications [19]. Addressing these challenges requires increased awareness among healthcare providers, implementation of gender-specific diagnostic tools, and enhanced patient education to promote early recognition and timely intervention [20].
Study objective
The objective of this study is to evaluate knowledge, attitude, and practice (KAP) gaps in women regarding ACS symptoms, risk factors, and treatment options. By assessing pre- and post-intervention awareness levels, this research aims to improve early diagnosis, healthcare-seeking behaviors, and treatment adherence among women. The findings will support the development of targeted awareness programs and clinical interventions to bridge the gender gap in cardiovascular health and reduce ACS-related mortality in women.
The methodology section describes in detail all the materials that have been used to conduct a study as well as the procedures that are under taken.
Study design: A hospital-based Prospective Observational Study
Study site: The study was conducted at the Vivekananda Super Speciality Hospital, Narasaraopet, Palnadu district.
Study period: The study was conducted over a period of 6 months.
Sample size: A total of 170 women subjects who were diagnosed with acute coronary syndrome and on regular check-ups were included in the study. Those who fulfilled the exclusion and inclusion criteria were selected for the study.
Study criteria: The study will be carried out by considering the following criteria:
Inclusion criteria
- Age > 20 years.
- Women who are diagnosed with ACS.
- Patient should be with a confirmed diagnosis of ACS in medical records by abnormal cardiac bio-markers, ECG changes symptomology.
- Patient should have ability to understand and speak Telugu, English, and Hindi.
Exclusion criteria
- Age < 20years.
- Gender- Male
- Multiple diagnosis of CVS which complicates the reorganization of ACS condition.
- Cognitive impairment or inability to understand or communicate.
The information provides the summary of all the results that are characterized based on various parameters.
Table 1: The distribution based on age as shown in Table 1. The data reveals that the highest prevalence of ACS is observed in the 50-59 age group of 30%(n = 59). Followed by the 60-69 age group 30%(n = 51), and the 40-49 age group, with n = 36 (21.17%). 70-79 age group includes n = 11 (6.47%), 80-90 age group has n = 5 (2.90%), n = 7 (4.11%) in the 30-39 age group and only n = 1 (0.58%) in the 20-29 age group (Figure 1).
| Table 1: Distribution based on Age of study population. | ||
| Age group | No. of patients | Percentage [%] |
| 20-29 | 1 | 0.5 |
| 30-39 | 7 | 4 |
| 40-49 | 36 | 21 |
| 50-59 | 59 | 35 |
| 60-69 | 51 | 30 |
| 70-79 | 11 | 6.5 |
| 80-90 | 5 | 3 |
| Grand Total | 170 | 100 |
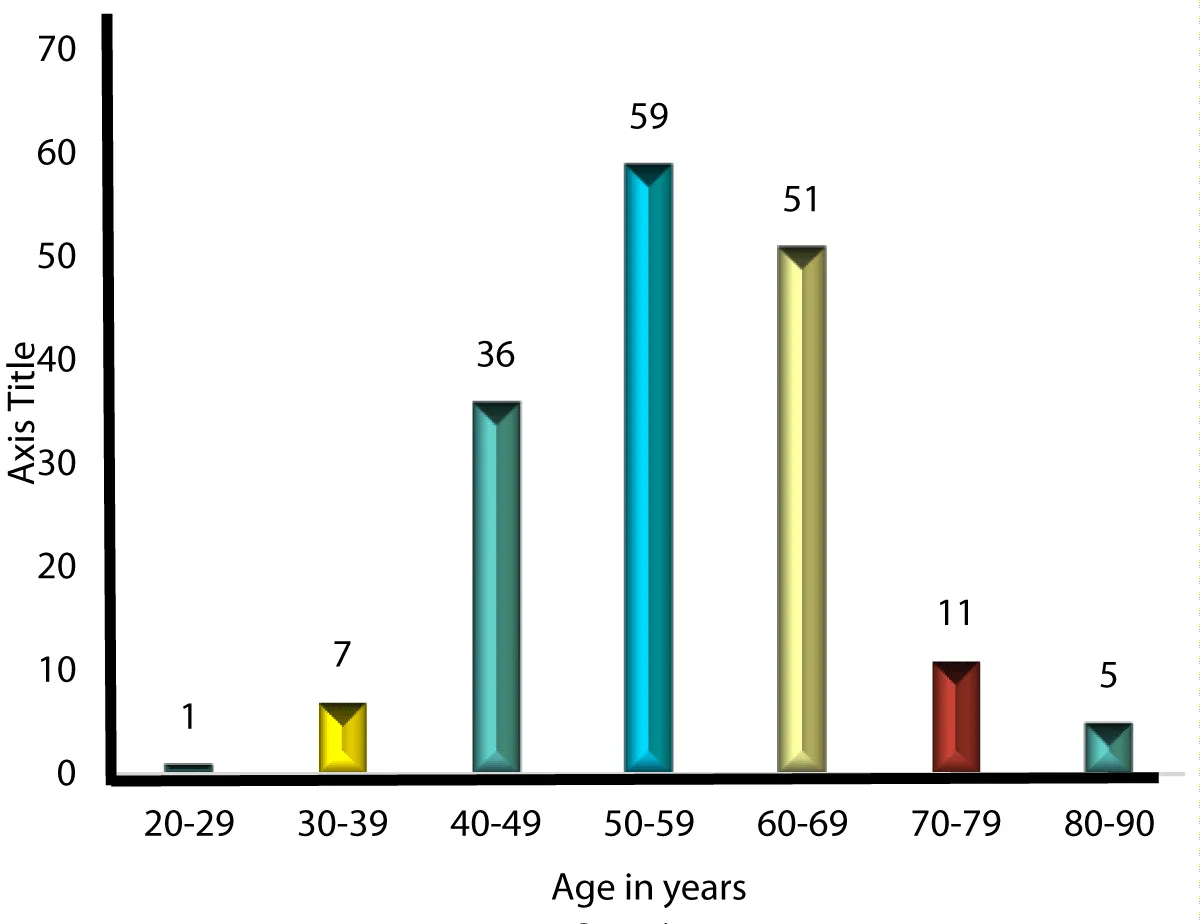
Figure 1: Distribution based on Age of study population.
Table 2: The data represents the literacy distribution among a total of 170 patients. Out of the total, 16 patients (9.4%) were literate, while a significantly larger group of 154 patients (90.58%) were illiterate. This indicates that the majority of the patients had not received formal education. The table underscores a high illiteracy rate within the patient population surveyed (Figure 2).
| Table 2: Distribution based on literacy rate of study population. | ||
| Parameters | No. of patients | Percentage [%] |
| Literacy rate | 16 | 9.4 |
| Illiteracy rate | 154 | 90.58 |
| Grand total | 170 | 100 |
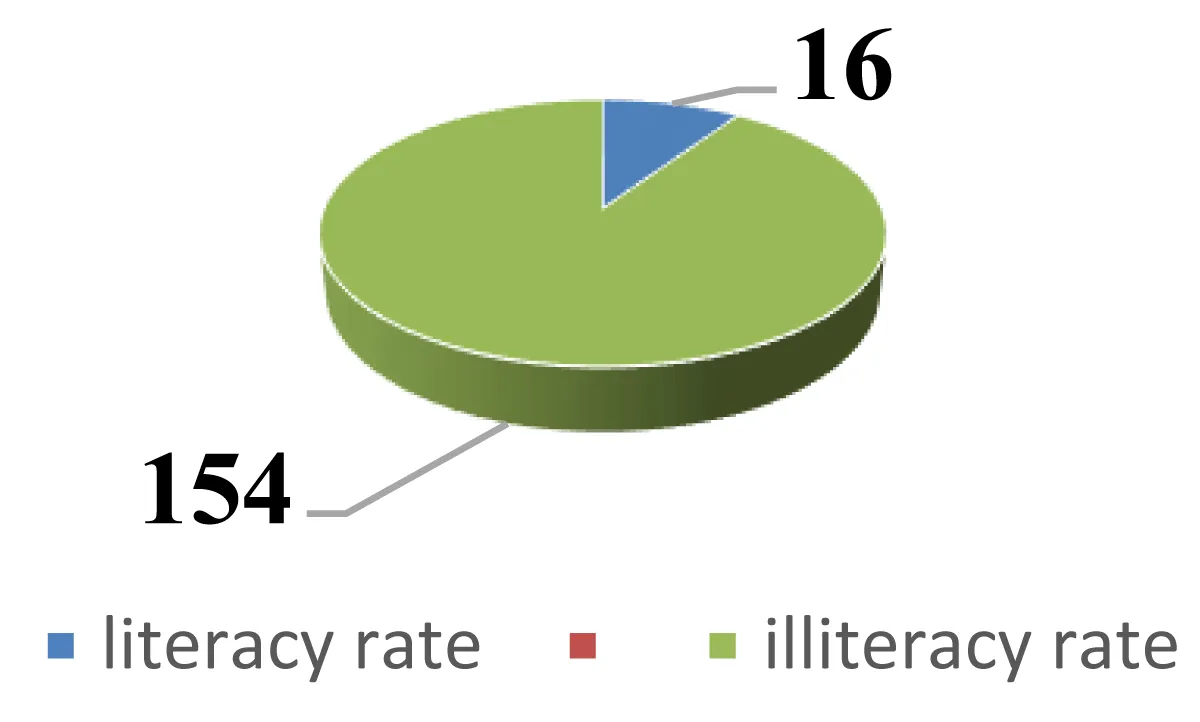
Figure 2: Distribution based on literacy rate of study population.
Table 3: Distribution based on BMI as shown in Table 2. Among 170 selected subjects most of the patients were overweight (n = 53), 31.17%, while the fewest were in class-III obesity 1 patient, 0.588%. The breakdown includes 7 underweight patients, 78 with normal weight, 3 with obesity, 21 in class-I obesity, and 7 in class-II obesity. This data highlights that overweight individuals formed the largest group, whereas severe obesity was rare (Figure 3).
| Table 3: Distribution based on BMI class of study population. | ||
| BMI ranges ( kg/m2) |
No. of Patients | Percentage [%] |
| Under weight | 7 | 4 |
| Normal weight | 78 | 46 |
| Over weight | 53 | 31 |
| Obesity | 3 | 1.7 |
| Class-I obesity | 21 | 12.3 |
| Class-II obesity | 7 | 4.1 |
| Class-III obesity | 1 | 0.5 |
| Grand Total | 170 | 100 |
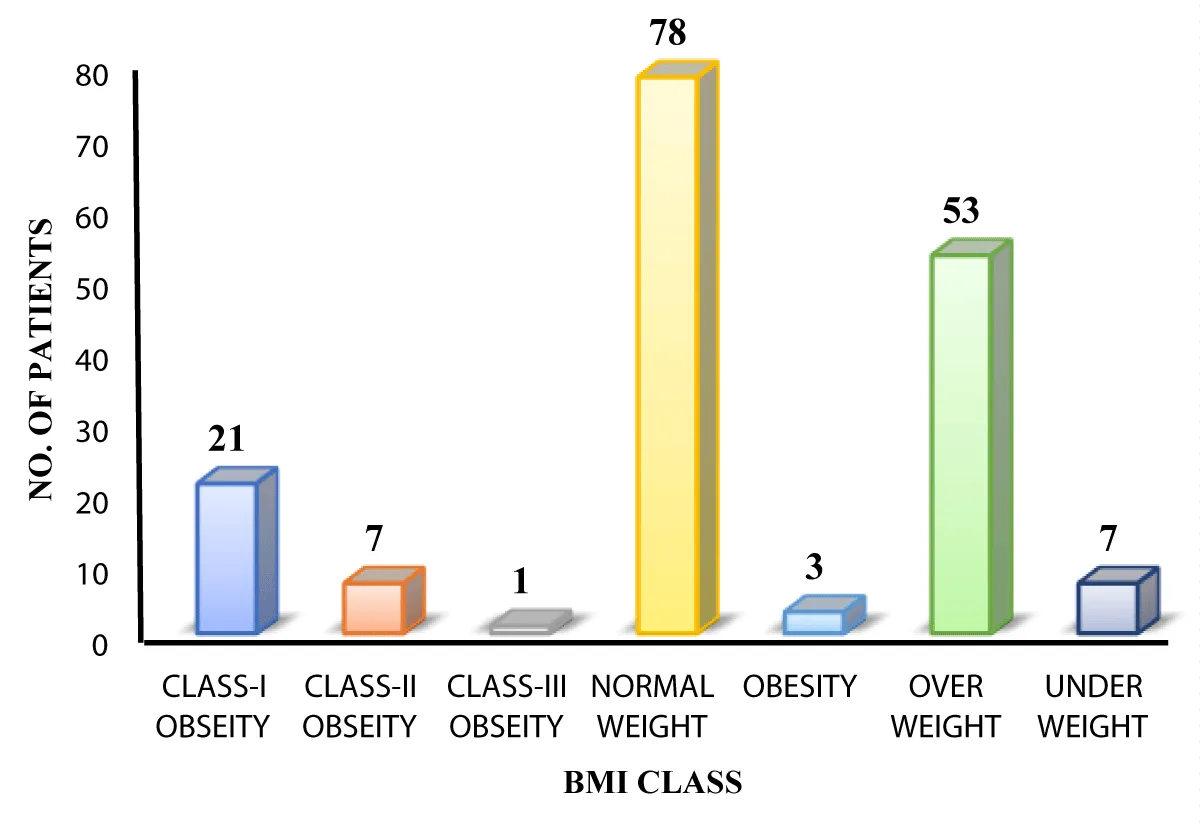
Figure 3: Distribution based on BMI class of study population.
Table 4: Distribution based on risk factors as shown in Table 3. Among 170 selected subjects, most of the population has major risk factor of hypertension n = 48, (28.23%), followed by type 2 diabetes mellitus (T2DM) alone n = 27, (15.88%), HTN with T2DM n = 24, (14.11%) and subjects with no risk factors n = 43 (23.5%) (Figure 4).
| Table 4: Distribution based on risk factors of study population. | ||
| Risk Factors | No. of Patients | Percentage [%] |
| Htn | 48 | 28 |
| Htn, cad | 4 | 2.5 |
| Htn, hyperthyroidism | 1 | 0.6 |
| Htn, hypothyroidism | 3 | 2 |
| Htn, t2dm | 24 | 14 |
| Htn,t2dm,hypothyroidim | 4 | 2.3 |
| Htn,t2dm,hypothyroidim, cad | 1 | 0.6 |
| Htn, tobacco smoker | 1 | 0.6 |
| Hyperthyroidism | 2 | 1.1 |
| Hypothyroidism | 3 | 2 |
| None | 43 | 25.3 |
| T2dm | 27 | 16.2 |
| T2dm, cad | 2 | 1.1 |
| T2dm, hypothyroidism | 4 | 2.5 |
| T2dm, mi | 1 | 0.6 |
| T2dm, ptca | 1 | 0.6 |
| Tobacco smoker | 1 | 0.6 |
| Grand Total | 170 | 100 |
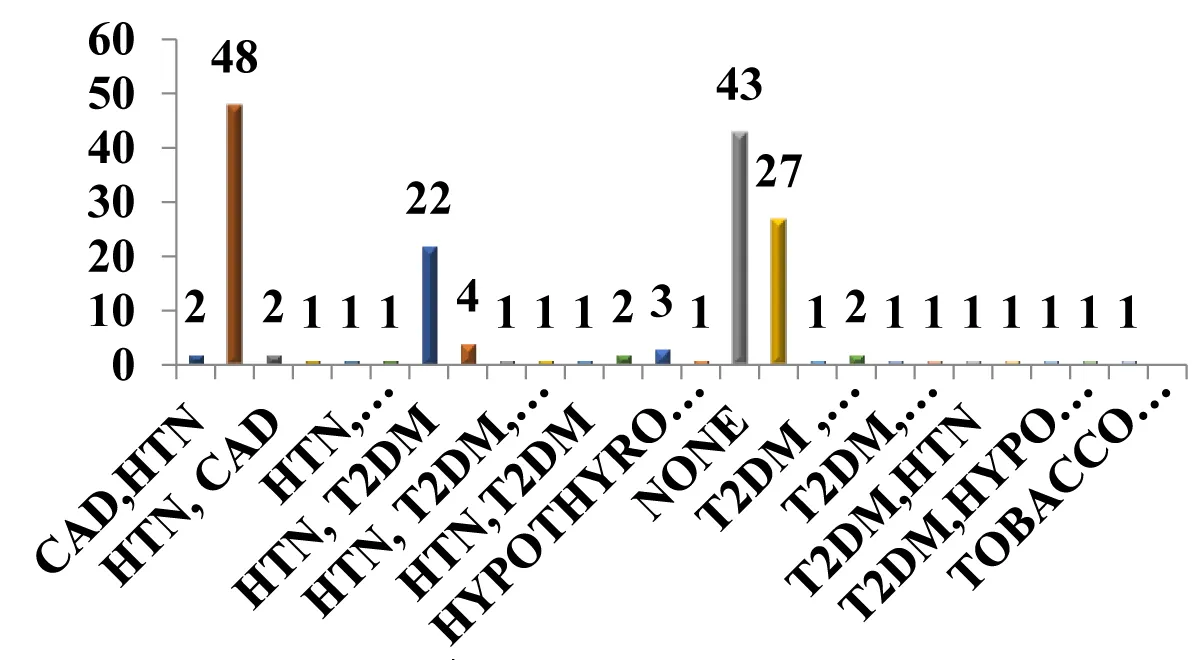
Figure 4: Distribution based on risk factors of study population.
Table 5: Distribution based on occupation as shown in Table 4. Most of the highest incidence was observed among housewives, accounting for 47.05% (n = 80). Followed by daily wagers at 18.82% (n = 32), agriculture workers at 9.41% (n = 16), and household workers at 7.64% (n = 13). Teachers comprised 7.05% (n = 12) of the cases, while factory workers represented 2.94% (n = 5). Additionally, cigar workers, tailors, and software professionals each accounted for 2.35% (n = 4) of the cases (Figure 5).
| Table 5: Distribution based on occupation of study population. | ||
| Occupation | No. of Patients | Percentage [%] |
| Agriculture worker | 16 | 9.4 |
| Cigar worker | 4 | 2.3 |
| Daily wager | 32 | 19 |
| Factory worker | 5 | 3 |
| House hold worker | 13 | 7.6 |
| House wife | 80 | 47 |
| Tailor | 4 | 2.3 |
| Teacher | 12 | 7.05 |
| Software holder | 4 | 2.35 |
| Grand total | 170 | 100 |
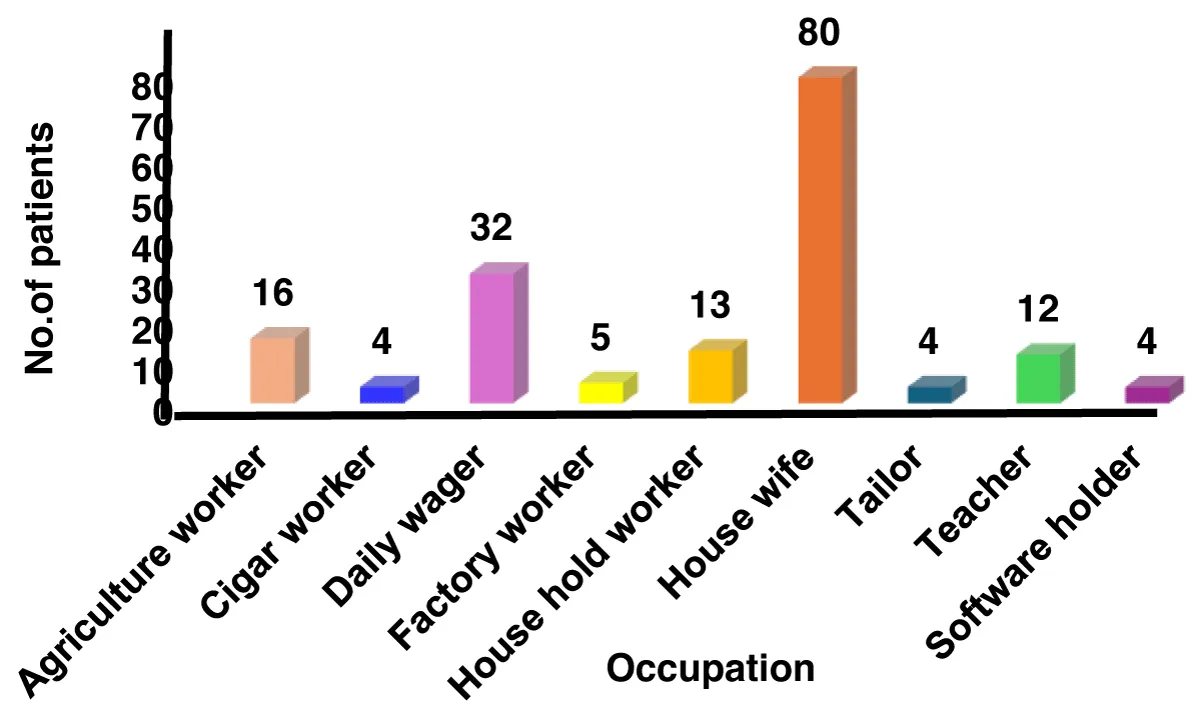
Figure 5: Distribution based on occupation of study population.
Table 6: Distribution base on type of presentation as shown in Table 5. It highlights chest pain as the most prevalent symptom, affecting 33% (n = 56), followed by chest pain associated with sweating 16%,(n = 28). Pain radiating to the shoulders, neck, and back accounts for 8.8% (n = 15), while shortness of breath (SOB) is reported by 6% (n = 11). Other notable symptoms include palpitations 5%,(n = 9), nausea 4%,(n = 7 ), and vomiting (3.5%,(n = 6), fatigue 3%, (n = 5), jaw pain 3%, (n = 5), indigestion 1%,(n = 2), nausea, vomiting, and dizziness (1-4%), as well as anxiety and confusion (1%) (Figure 6).
| Table 6: Distribution base on type of presentation of study population. | ||
| Type Of Presentation | No. of Patients | Percentage [%] |
| Chest Pain | 56 | 33 |
| Chest Pain Associating with Sweating | 28 | 16 |
| Pain Radiating to Shoulders, neck, & back | 15 | 8.8 |
| SOB | 11 | 6 |
| Headache | 4 | 2.3 |
| Diarrhoea | 2 | 1 |
| Fatigue | 5 | 3 |
| Palpitations | 9 | 5 |
| Fainting | 5 | 3 |
| Giddiness | 3 | 1.7 |
| Nausea | 7 | 4 |
| Vomitings | 6 | 3.5 |
| Jaw Pain | 5 | 3 |
| Fever | 2 | 1 |
| Stomach Pain | 3 | 1.7 |
| Dyspnea | 2 | 1 |
| Pedal Edema | 2 | 1 |
| Loss Of Appitite | 1 | 0.5 |
| Abdominal Pain | 1 | 0.5 |
| Indigestion | 2 | 1 |
| Confusion | 2 | 1 |
| Anxiety | 1 | 0.5 |
| Acidity | 1 | 0.5 |
| Pedal Edema | 2 | 1 |
| Grand total | 170 | 100 |
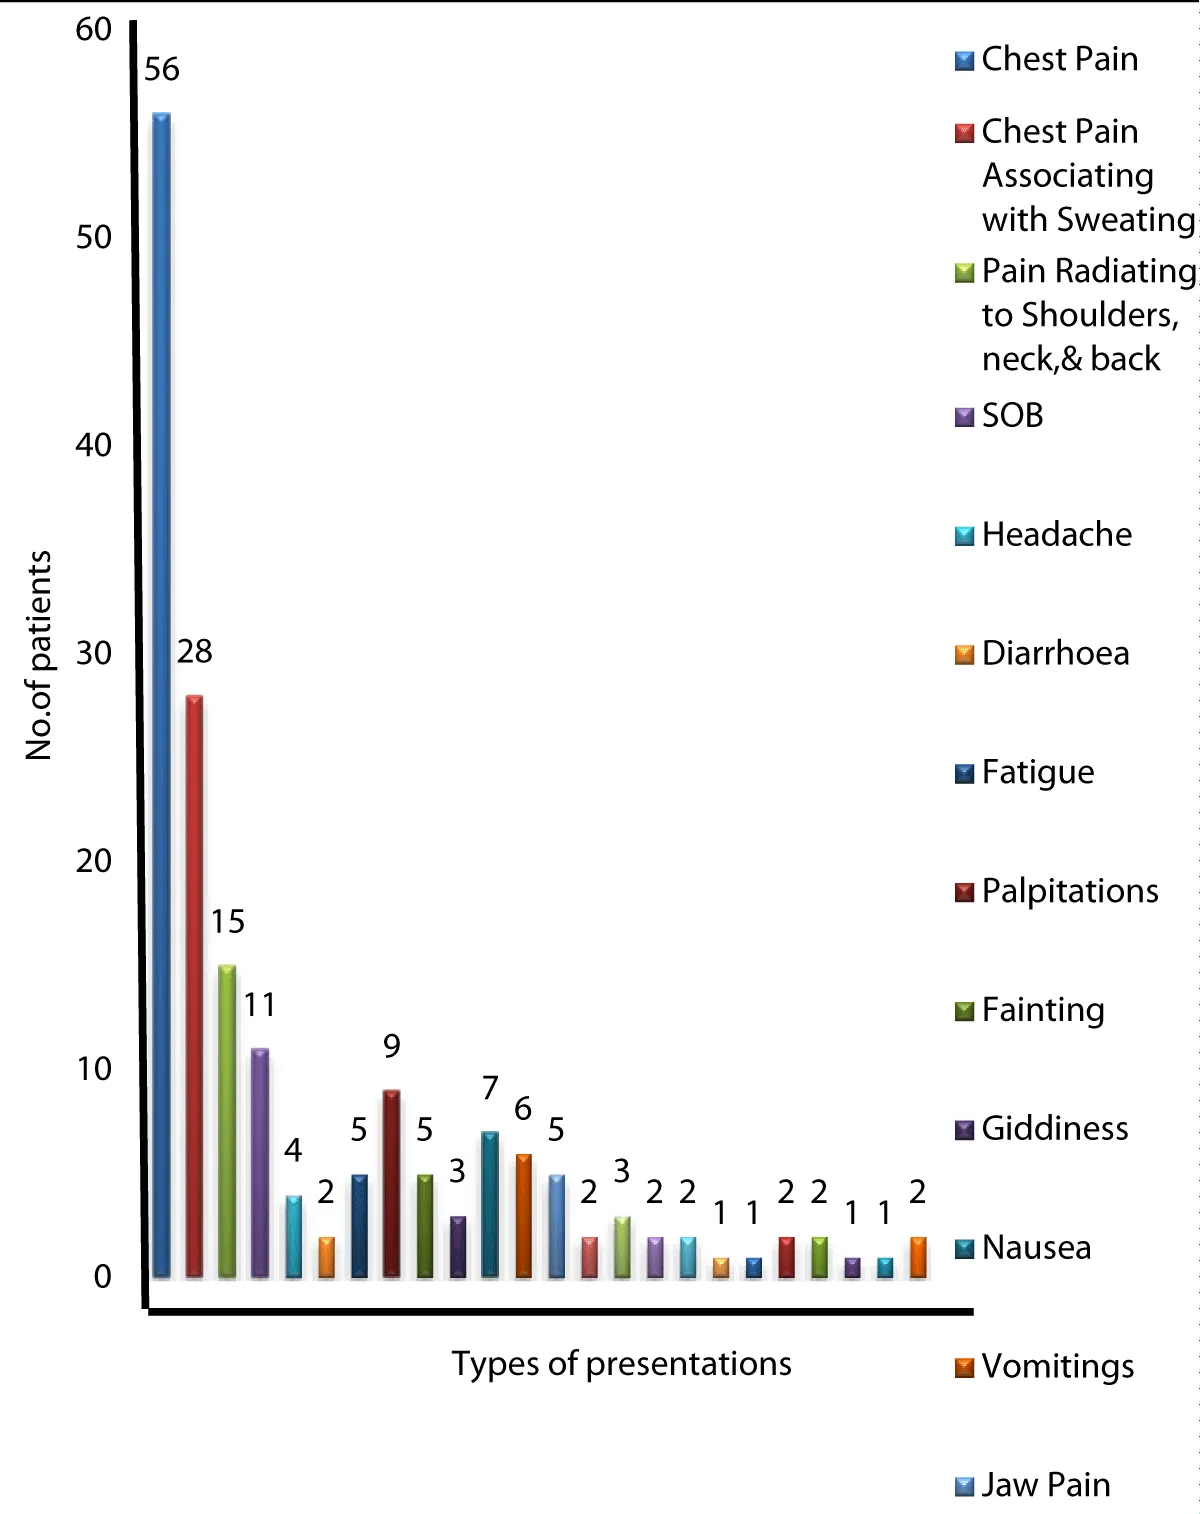
Figure 6: Distribution base on type of presentation of study population.
Table 7: Distribution based on knowledge levels at initial visit as shown in Table 6. The data shows that most patients had average knowledge n = 90(52.94%). Followed by poor knowledge has n = 58(34.17%), fewer in good knowledge has n = 22(12.94%) (Figure 7).
| Table 7: Distribution based on knowledge at initial visit of study population | ||
| Knowledge | No. of patients | Percentage [%] |
| Poor | 58 | 34 |
| Average | 90 | 53 |
| Good | 22 | 13 |
| Grand total | 170 | 100 |
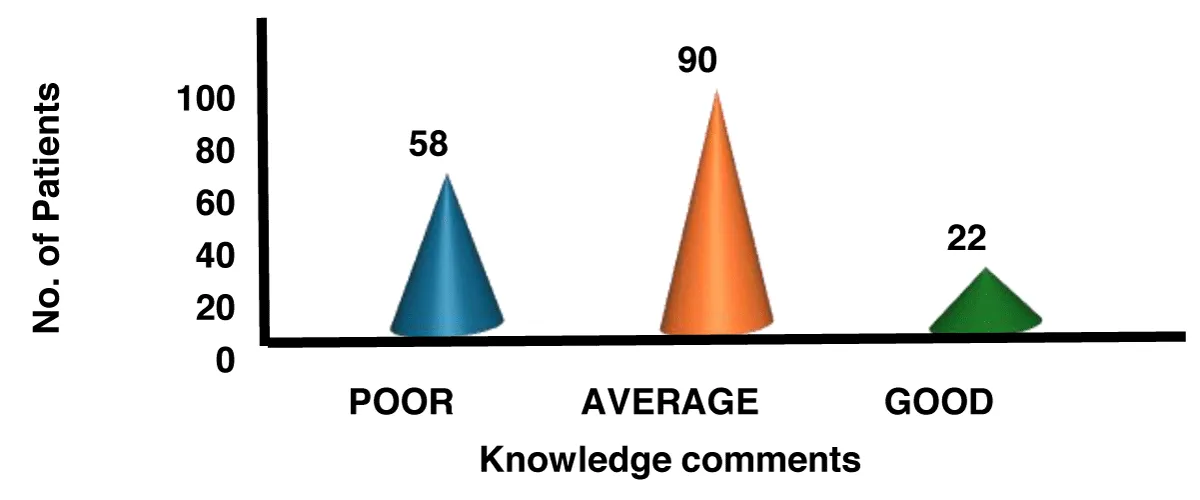
Figure 7: Distribution based on knowledge at initial visit of study population.
Table 8: Distribution based on attitude levels at initial visit as shown in Table 7. The data shows that most patients had average attitude n = 128(75.3%). Followed by poor attitude has n = 35(20.5%), fewer in good attitude has n = 7 (4.11%) (Figure 8).
| Table 8: Distribution based on Attitude at initial visit of study population. | ||
| Attitude | No. of patients | Percentage[%] |
| Poor | 35 | 20.5 |
| Average | 128 | 75.5 |
| Good | 7 | 4 |
| Grand Total | 170 | 100 |
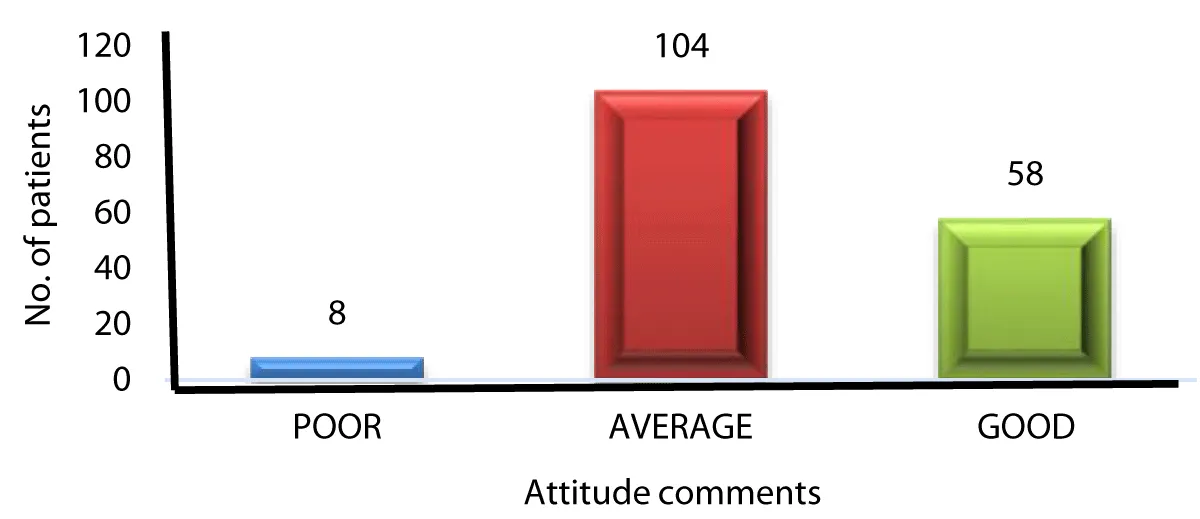
Figure 8: Distribution based on Attitude at initial visit of study population.
Table 9: Distribution based on practice levels at initial visit as shown in Table 8. The data shows that most patients had average practice n = 70(41.17%). Followed by poor practice has n = 97(57.05%), fewer in good practice has n = 3(1.76%) (Figure 9).
| Table 9: Distribution based on Practice at initial visit of study population. | ||
| Practice | No. of patients | Percentage [%] |
| Poor | 97 | 57 |
| Average | 70 | 41 |
| Good | 3 | 2 |
| Grand total | 170 | 100 |
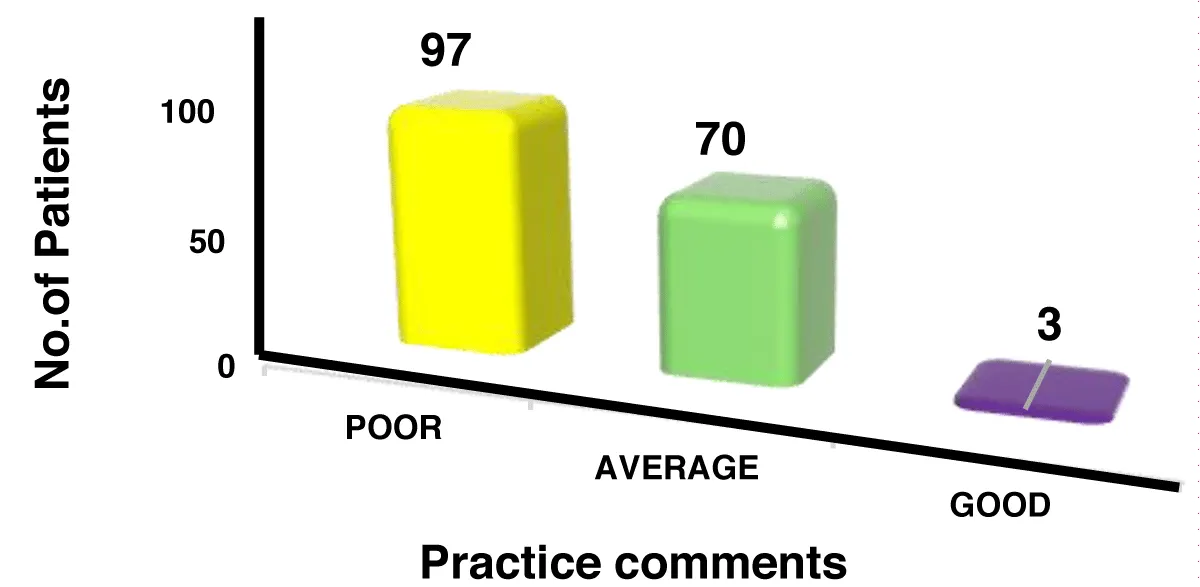
Figure 9: Distribution based on Practice at initial visit of study population.
Table 10: Distribution based on overall KAP scoring at Initial visit as shown in Table 9. A significant portion of the patients, 87 individuals (51.17%), were classified as having a poor KAP score, indicating that more than half of the patient population demonstrated lower levels of knowledge, attitude, and practice. The next largest group, 77 patients (45.3%), had an average KAP score, suggesting that many patients performed at a moderate level in these areas. Only 6 patients (3.52%) were classified as having a good KAP score, reflecting a very small proportion with higher knowledge, attitude, and practice. This distribution emphasizes that most patients fall within the average to poor range in terms of KAP (Figure 10).
| Table 10: Distribution based on overall KAP scoring at Initial visit of study population. | ||
| KAP Scoring | No. of Patients | Percentage [%] |
| Poor | 87 | 51.1 |
| Average | 77 | 45.3 |
| Good | 6 | 3.6 |
| Grand Total | 170 | 100% |
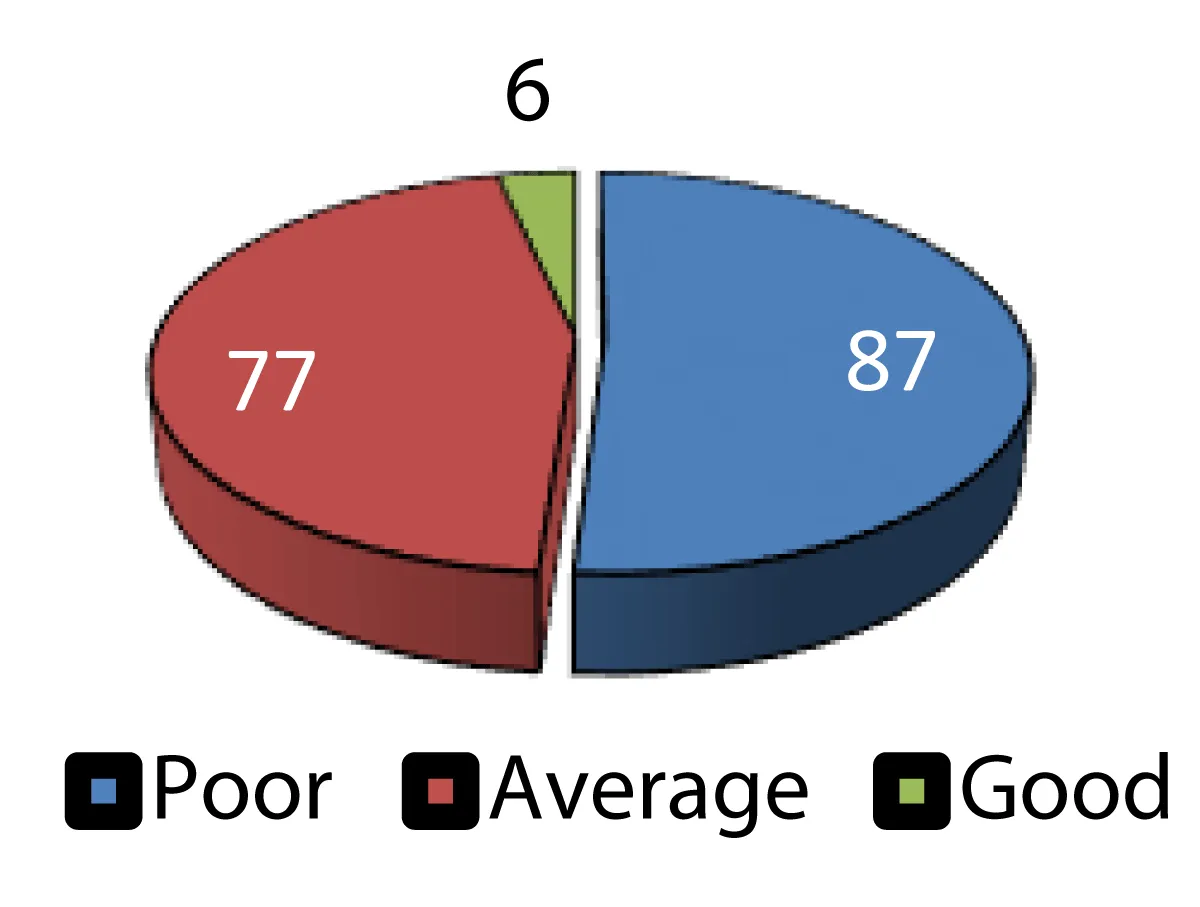
Figure 10: Distribution based on overall KAP scoring at Initial visit of study population.
Table 11: Distribution based on knowledge levels at follow up visit as shown in Table 10. The data shows that most patients had average knowledge n = 102(60%). Followed by good knowledge has n = 61(35.9%), poor knowledge has n = 7(4.117%) (Figure 11).
| Table 11: Distribution based on knowledge levels at follow up visit of study population. | ||
| Knowledge | No. of patients | Percentage [%] |
| Poor | 7 | 4 |
| Average | 102 | 60 |
| Good | 61 | 36 |
| Grand total | 170 | 100 |
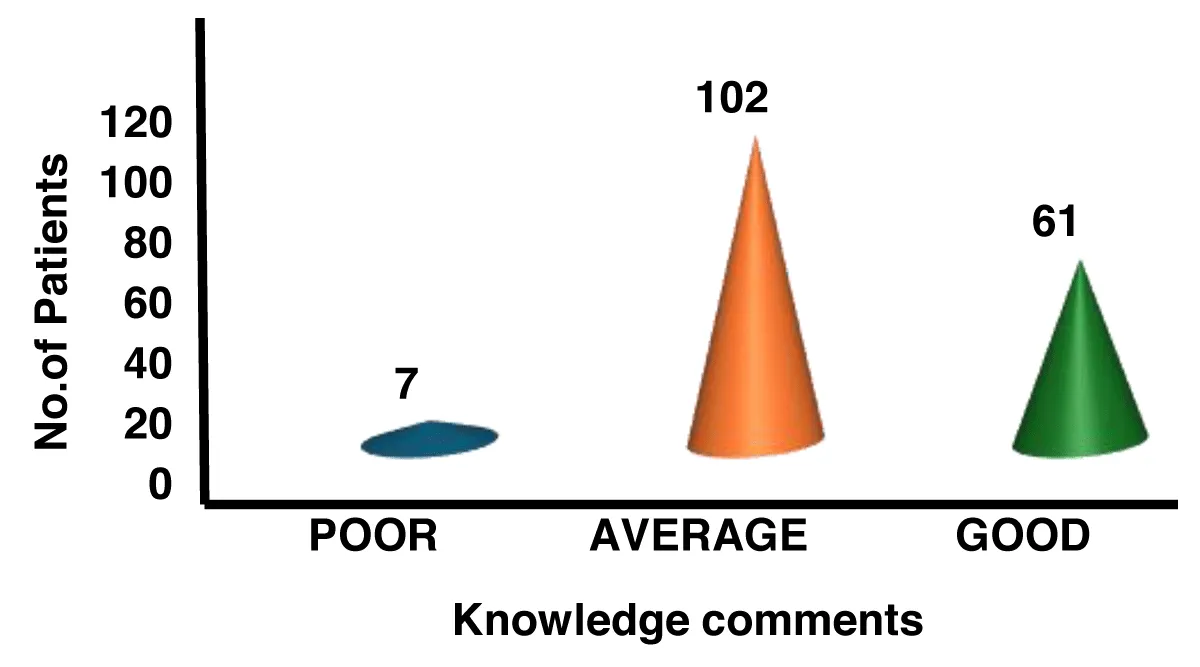
Figure 11: Distribution based on knowledge levels at follow up visit of study population.
Table 12: Distribution based on attitude levels at follow up visit as shown in Table 11. The data shows that most patients had average attitude n = 104(61.17%). Followed by good attitude has n = 58(34.11%), poor practice has n = 8(4.70%) (Figure 12).
| Table 12: Distribution based on Attitude levels at follow up of study population. | ||
| Attitude | No. of patients | Percentage [%] |
| POOR | 8 | 4.7 |
| AVERAGE | 104 | 61.2 |
| GOOD | 58 | 34.1 |
| Grand Total | 170 | 100% |
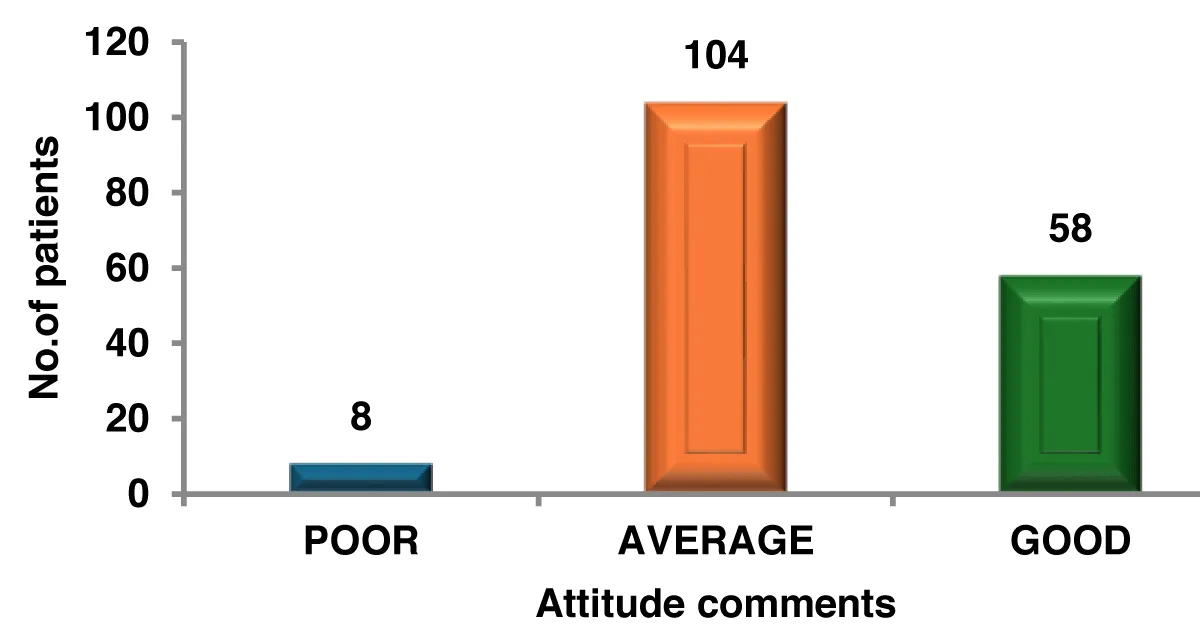
Figure 12: Distribution based on Attitude levels at follow up of study population.
Table 13: Distribution based on practice levels at follow up visit as shown in Table 12. The data shows that most patients had average attitude n = 105(61.76%). Followed by good practice has n = 43(25.30%), poor practice has n = 22(12.94%) (Figure 13).
| Table 13: Distribution based on Practice levels at follow up of study population. | ||
| Practice | No. of patients | Percentage [%] |
| Poor | 22 | 13 |
| Average | 105 | 61.7 |
| Good | 43 | 25.3 |
| Grand total | 170 | 100 |
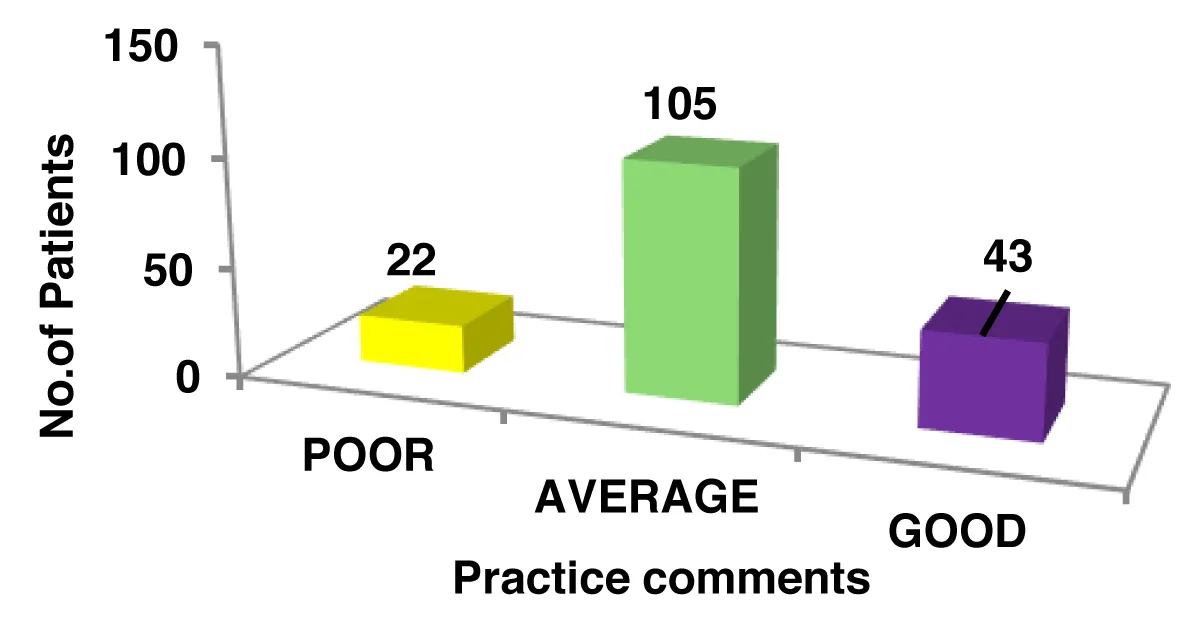
Figure 13: Distribution based on Practice levels at follow up of study population.
Table 14: Distribution based on KAP (Knowledge, Attitude, and Practice) scores at follow up visit as shown in table 13. With most (97 individuals or 57.05%) falling into the average category, indicating a moderate level of understanding and adherence. A notable 64 patients (37.64%) achieved a good KAP score, reflecting strong knowledge and practice. Meanwhile, only 9 patients (5.29%) had poor scores, showing lower levels of awareness and adherence. Overall, the data suggests that the majority of patients performed at an average or good level, with only a small fraction scoring poorly (Figure 14).
| Table 14: Distribution based on KAP scoring at follow up of study population. | ||
| KAP Score | No. of Patients | Percentage [%] |
| Poor | 9 | 5.3 |
| Average | 97 | 57 |
| Good | 64 | 37.7 |
| Grand Total | 170 | 100 |
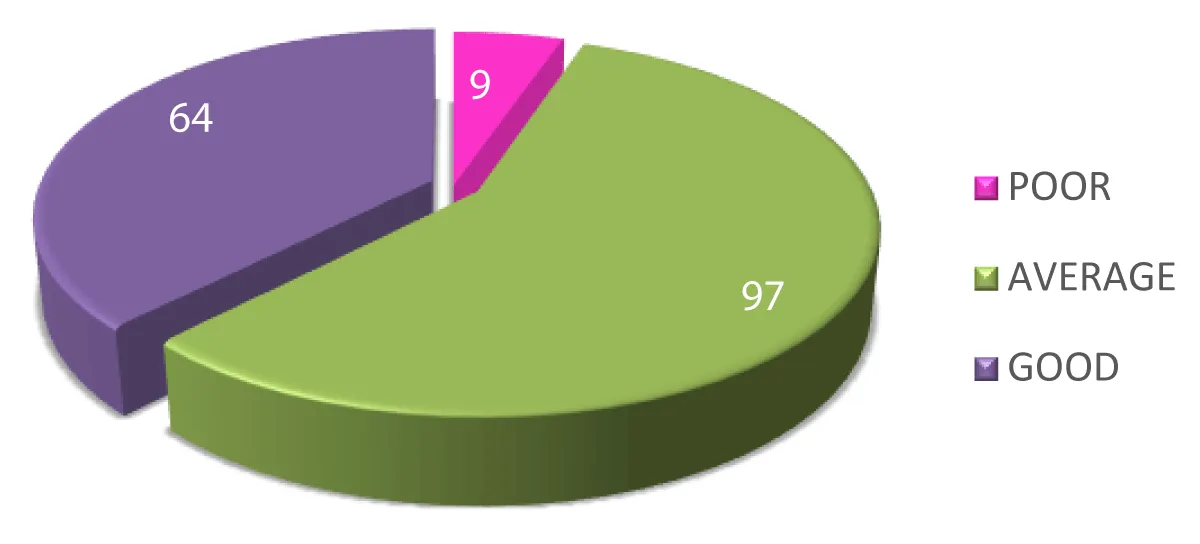
Figure 14: Distribution based on KAP scoring at follow up of study population.
Table 15: Distribution based on overall KAP % of both Initial and Follow up visit as shown in Table 14. Poor scores dropped from 28.82% (n = 49) to 3.53% (n = 6), while average scores declined from 58.82% (n = 100) to 35.29% (n = 60), reflecting overall progress. Good scores increased from 11.76% (n = 20) to 45.88% (n = 78), and excellent scores saw the most remarkable rise, from 0.59% (n = 1) to 15.29% (n = 26). This data highlights a clear upward trend in patients’ knowledge, attitude, and practice over time (Figure 15).
| Table 15: Distribution based on overall KAP % of both Initial and Follow up visit of study. | ||
| KAP% | Initial visit | Follow up visit |
| Poor | 49 | 6 |
| Average | 100 | 60 |
| Good | 20 | 78 |
| Excellent | 1 | 26 |
| Grand total | 170 | 170 |
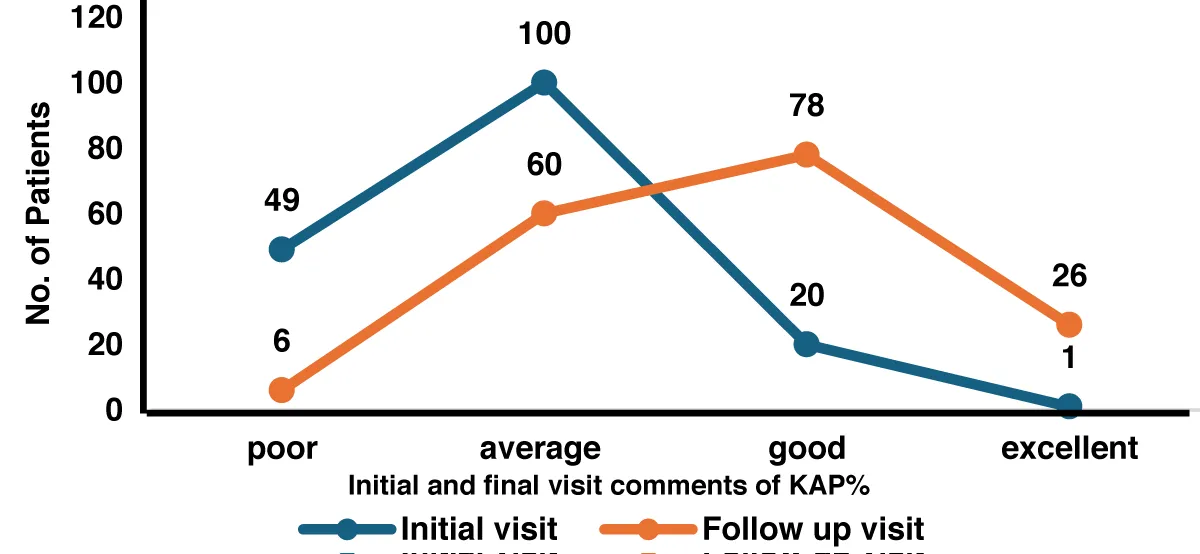
Figure 15: Distribution based on overall KAP % of both Initial and Follow up visit of study population.
Table 16: Distribution based on Quality of Life (QOL) comments from initial and follow-up visits as shown in Table 15. Highlights a noticeable shift in perception. Initially, the majority of comments (n = 101) rated QOL as Poor, while n = 69 were categorized as Average, and none were considered Good. However, by the follow-up visit, there was a significant improvement, with Average ratings rising to (n = 132), Poor ratings decreasing to (n = 12), and (n = 26) comments reflecting a good rating (Figure 16).
| Table 16: Distribution based on overall QOL scoring of both Initial and Follow up visit of study population. | ||
| QOL Comments | Initial visit | Follow up visit |
| Poor | 101 | 12 |
| Average | 69 | 132 |
| Good | 0 | 26 |
| Grand Total | 170 | 170 |
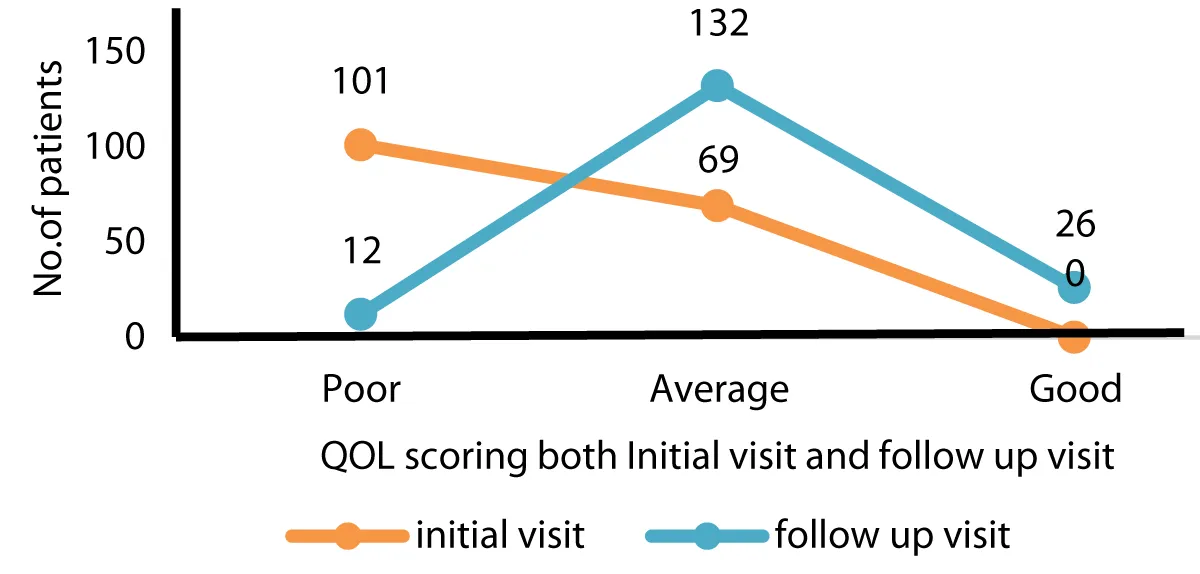
Figure 16: Distribution based on overall QOL scoring of both Initial and Follow up visit of study population.
This 6-month prospective observational study conducted at Vivekananda Super Speciality Hospital in Narasaraopet involved 170 women diagnosed with Acute Coronary Syndrome (ACS). Most of the patients were middle-aged to older adults, with the highest prevalence in the 50-59 and 60-69 age groups. The very low occurrence in younger patients (20-29) aligns with the understanding that ACS is more common in older individuals due to the natural stiffening of arteries and plaque accumulation.
A majority of the patients had a normal weight (45.88%) or were overweight (31.17%), with fewer in other categories. Being overweight can increase the risk of atherosclerosis, highlighting the importance of weight management. The most common risk factor was hypertension (28.23%), followed by a combination of hypertension and Type 2 Diabetes Mellitus (14.11%). Other prevalent conditions included coronary artery disease and thyroid disorders.
In terms of occupation, housewives (47.05%) and daily wage earners (18.82%) were most affected, likely due to socio-economic factors, sedentary lifestyles, and limited access to healthcare. Chest pain was the most frequent symptom, followed by shortness of breath and sweating. Atypical symptoms, such as jaw pain and confusion, were also observed, underscoring the need for careful clinical evaluation.
At the initial visit, 52.94% of patients had an average level of knowledge, 34.17% had poor knowledge, and only 12.94% demonstrated good knowledge. A majority (75.3%) had a neutral attitude toward their health, and 57.05% showed poor adherence to recommended practices, indicating the necessity for enhanced education and behavioral support. The majority (51.17%) of patients had poor KAP scores.
By the follow-up visit, there was a noticeable improvement in patient knowledge, with 35.9% achieving good knowledge. A shift toward more proactive health behaviors was evident, with 34.11% exhibiting a positive attitude. Furthermore, 25.3% demonstrated improved practice adherence. Most patients (37.64%) achieved good KAP scores.
There was a significant improvement in KAP scores, with the percentage of patients with poor scores declining from 28.82% to 3.53%, while those with good scores increased from 11.76% to 45.88%. The proportion of patients with excellent scores grew from 0.59% to 15.29%. Quality of Life (QOL) also saw substantial improvement, with poor QOL dropping from 59.41% to 7.06%, and the percentage of patients reporting good QOL rising from 0% to 15.29%.
This study underscores the importance of enhancing knowledge, attitude, and practice for effective ACS management. The significant improvements in KAP and QOL scores emphasize the need for targeted educational initiatives and behavioral interventions, particularly for middle-aged individuals affected by hypertension and obesity.
This research highlights the pressing need to improve women’s awareness, perceptions, and behaviors regarding Acute Coronary Syndrome (ACS). It brings attention to the significant gender-based differences in symptom identification and access to medical care, with Yentl Syndrome contributing to delays in diagnosis and poorer health outcomes. The study reveals a high prevalence of conditions such as hypertension, diabetes, and obesity, emphasizing the importance of routine health screenings and comprehensive cardiovascular risk evaluations. Educational initiatives have been shown to significantly enhance awareness, encourage proactive health practices, and support better adherence to treatment and lifestyle modifications.
The results demonstrate a considerable improvement in KAP levels and overall quality of life after targeted interventions. A decline in the number of individuals with poor scores, alongside an increase in those achieving good or excellent scores, reflects the positive impact of awareness campaigns. Addressing these disparities requires the implementation of gender-sensitive diagnostic approaches and specialized educational programs to ensure earlier detection and better ACS management in women. Continued research and public health efforts should focus on maintaining these improvements through sustained education, lifestyle interventions, and systemic healthcare advancements to lower cardiovascular-related mortality among women.
- Sanchis-Gomar F, Perez-Quilis C, Leischik R, Lucia A. Epidemiology of coronary heart disease and acute coronary syndrome. Ann Transl Med. 2016;4(13):256. Available from: https://doi.org/10.21037/atm.2016.06.33
- O'Gara PT, Kushner FG, Ascheim DD, Casey DE, Chung MK, et al. 2013 ACCF/AHA guideline for the management of ST-elevation myocardial infarction. J Am Coll Cardiol. 2013;61(4):e78-e140. Available from: https://www.jacc.org/doi/abs/10.1016/j.jacc.2012.11.019
- Ross R, Glomset JA. Atherosclerosis and the arterial smooth muscle cell. Science. 1976;193(4251):1094-1100.
- Topol EJ, Bhatt DL. Acute coronary syndromes: Clinical diagnosis and treatment. Lancet. 2004;363(9410):1075-1085.
- Sakamoto A, Cornelissen A, Sato Y, Mori M, Kawakami R, Kawai K, et al. Vulnerable plaque in patients with acute coronary syndrome: Identification, importance, and management. US Cardiol. 2022 Jan 26;16:e01. Available from: https://doi.org/10.15420/usc.2021.22
- Li X, Yan F, Liu X, Li M, Li J, Chen Y, et al. Acute coronary syndrome screening in patients presenting with arteriosclerosis in health check-ups: A case-control study. BMJ Open. 2023 Aug 21;13(8):e062596. Available from: https://doi.org/10.1136/bmjopen-2022-062596
- Canto JG, Hand MM, Bonow RO, Sopko G, Pepine CJ, et al. Symptom presentation of women with acute coronary syndrome: Myth versus reality. Circulation. 2011;124(13):1415-1425.
- American Heart Association. American Heart Association [Internet]. Dallas (TX): American Heart Association. Available from: https://www.heart.org/
- Colhoun HM. Cardiovascular disease in diabetes. Lancet Diabetes Endocrinol. 2014;2(1):8-18.
- Mendis S. Global status report on noncommunicable diseases. World Health Organization; 2011. Available from:
- Libby P, Ridker PM, Maseri A. Inflammation and atherosclerosis. Circulation. 2002 Mar 5;105(9):1135-43. Available from: https://doi.org/10.1161/hc0902.104353
- Ford ES. Age and coronary heart disease: The role of inflammation. Circulation. 2011;124(6):719-721.
- Steptoe A, Kivimäki M. Stress and cardiovascular disease. Nat Rev Cardiol. 2013;10(6):369-380. Available from: https://www.nature.com/articles/nrcardio.2012.45
- Reynolds K. Alcohol consumption and risk of coronary heart disease: A meta-analysis. JAMA. 2003;289(5):576-583.
- Blumenthal JA, Smith PJ. Psychological risk factors in cardiovascular disease. Curr Psychiatry Rep. 2014;16(9):478.
- Gibbons RJ. Diagnosis and treatment of chronic stable angina: A report of the American College of Cardiology/American Heart Association Task Force on Practice Guidelines. Circulation. 2003;107(1):149-158.
- DiPiro JT, Talbert RL, Yee GC, Matzke GR, Wells BG, Posey LM. Pharmacotherapy: A pathophysiologic approach. 9th ed. McGraw-Hill Education; 2014.
- Gulati M. Yentl’s Bikini: Sex differences in STEMI. J Am Heart Assoc. 2019 May 21;8(10). Available from: https://doi.org/10.1161/jaha.119.012873
- Wolpert S. Yentl syndrome: A deadly data bias against women. Longreads. 2019 Jun 21 [cited 2024 Sep 5]. Available from: https://longreads.com/2019/06/21/yentl-syndrome-a-deadly-data-bias-against-women/
- Vaina S, Milkas A, Crysohoou C, Stefanadis C. Coronary artery disease in women: From the Yentl syndrome to contemporary treatment. World J Cardiol. 2015;7(1):10-18. Available from: https://doi.org/10.4330/wjc.v7.i1.10