
More Information
Submitted: September 19, 2025 | Approved: September 25, 2025 | Published: September 26, 2025
How to cite this article: Zhu P, Hu Y. Association between the Stress Hyperglycemia Ratio Index and Short-term All-cause Mortality as well as ICU All-cause Mortality in Heart Failure Patients Receiving Invasive Ventilation: A Retrospective Study Based on the MIMIC-IV Database. J Cardiol Cardiovasc Med. 2025; 10(5): 113-126. Available from:
https://dx.doi.org/10.29328/journal.jccm.1001218
DOI: 10.29328/journal.jccm.1001218
Copyright license: © 2025 Zhu P, et al. This is an open access article distributed under the Creative Commons Attribution License, which permits unrestricted use, distribution, and reproduction in any medium, provided the original work is properly cited.
Keywords: Stress hyperglycemia ratio; Heart failure; Invasive mechanical ventilation; MIMIC-IV database

Association between the Stress Hyperglycemia Ratio Index and Short-term All-cause Mortality as well as ICU All-cause Mortality in Heart Failure Patients Receiving Invasive Ventilation: A Retrospective Study Based on the MIMIC-IV Database
Pengcheng Zhu and Yuan Hu*
Department of Anesthesiology, The Second People’s Hospital of Hefei, Hefei Hospital Affiliated to Anhui Medical University, Hefei, Anhui, People’s Republic of China
*Address for Correspondence: Koudougou Jonas Kologo, Yalgado Ouedraogo Teaching Hospital, Ouagadougou, Burkina Faso, Email: [email protected]
Background: The stress-induced hyperglycemic ratio (SHR) is an index that reflects the imbalance between acute stress-induced glucose fluctuations and baseline glucose metabolism levels. Currently, there are few studies on the SHR index and its prognostic significance in heart failure (HF) patients undergoing invasive mechanical ventilation. This study aimed to investigate the relationship of SHR with the risk of death in HF patients requiring invasive ventilation.
Methods: Conduct a retrospective cohort study based on the Medical Information Mart for Intensive Care IV (MIMIC-IV) database. Include adult heart failure patients who received invasive ventilation and divide them into quartile groups according to the level of the Systemic Heart Rate (SHR). The primary endpoints of the observation are the 30-day all-cause mortality rate and the all-cause mortality rate in the Intensive Care Unit (ICU), while the secondary endpoints are the 365-day all-cause mortality rate and the all-cause mortality rate during hospitalization. The Kaplan-Meier curve is used to compare the survival outcomes between groups. A Cox proportional hazards regression model that adjusts for demographic characteristics, underlying diseases, and the severity of critical illnesses is employed to evaluate the relationship between SHR and the mortality rate. The Restricted Cubic Spline (RCS) is utilized to test the nonlinear association between the two, and subgroup analysis is carried out to verify the consistency of the results across different groups.
Results: Among the 1,038 eligible patients, the mean age was 68.50 years (range: 59.46 - 77.48 years), and 639 (61.56%) of them were male. The Kaplan-Meier curve showed that the higher the SHR index, the higher the risk of all-cause mortality in patients at 30 days (log-rank test, p = 0.011) and in the ICU (log-rank test, p = 0.0029). An increase in SHR was independently associated with an increased risk of 30-day and ICU mortality. Compared with the second quartile group Q2, the 30-day mortality rate in the group with the highest SHR was significantly higher (HR = 1.59, 95% CI 1.08, 2.33), and the ICU mortality rate in the group with the highest SHR was significantly higher (HR = 1.86, 95% CI 1.10, 3.14). The restricted cubic spline analysis showed a non-linear dose-response relationship between SHR and 30-day all-cause mortality (p for non-linearity < 0.05), and the risk of 30-day and ICU all-cause mortality gradually increased with the increase of the SHR index. The risks of 30-day and all-cause mortality in the ICU gradually increased. The results of the subgroup analysis confirmed that it remained stable in the subgroup of patients with Coronary Heart Disease (CHD).
Conclusion: In critically ill heart failure (HF) patients receiving invasive ventilation, a higher stress hyperglycemia ratio (SHR) index is significantly associated with an increased risk of 30-day and all-cause mortality in the intensive care unit (ICU). Meanwhile, the SHR index is an independent predictor of mortality in critically ill HF patients who require invasive ventilation.
Heart failure (HF), representing the advanced stage of cardiovascular diseases, poses a major global public health challenge. With around 64.3 million HF patients worldwide, the condition places a significant strain on healthcare systems [1,2]. In ICUs, acute decompensated HF patients often require invasive ventilation due to respiratory failure, frequently accompanied by multi-organ dysfunction [3,4]. Despite this, studies on prognostic markers for critically ill HF patients undergoing invasive ventilation are limited. Identifying and addressing risk factors are essential for improving survival in this population.
Emerging evidence highlights the stress-induced hyperglycemia ratio (SHR) as a key predictor of poor outcomes in critically ill patients. For instance, elevated SHR levels in acute myocardial infarction patients are strongly linked to cardiogenic shock and in-hospital mortality [5]. Similarly, in sepsis, SHR is associated with organ dysfunction progression and 28-day mortality [6]. SHR also shows significant prognostic value in stroke patients [7]. However, its role in HF patients requiring invasive ventilation remains underexplored.
SHR, a marker of metabolic dysregulation in critical illness, is tied to heightened inflammation, endothelial damage, and immune suppression [8]. Traditional glucose measures, such as fasting glucose and HbA1c, are often skewed by baseline glucose levels during acute stress. To address this, SHR—calculated as the ratio of admission glucose to estimated average glucose (derived from HbA1c)—provides a more accurate reflection of acute glucose fluctuations by accounting for baseline glucose status [9,10].
This study aims to explore the predictive value of the stress hyperglycemia ratio (SHR) for the 30-day and all-cause mortality in the intensive care unit (ICU) among heart failure patients receiving invasive mechanical ventilation. The research findings may provide new insights into the early identification of these patients and strategies for improving their prognosis.
Data source
This retrospective investigation employed clinical data extracted from the Medical Information Mart for Intensive Care IV (MIMIC-IV v3.0), a publicly accessible repository designed for critical care research. As an evolution of the earlier MIMIC-III platform, MIMIC-IV integrates expanded datasets with optimized structural frameworks, enhancing interoperability and analytical utility. The database aggregates de-identified health records from Beth Israel Deaconess Medical Center (BIDMC) spanning 2008 to 2019, comprising 190,000+ unique patients and 450,000+ hospitalization events. Comprehensive variables are catalogued, including demographic profiles, laboratory metrics, pharmacological interventions, perioperative documentation, diagnostic classifications, and longitudinal survival outcomes. To ensure compliance with ethical standards, all researchers completed mandatory training modules endorsed by the National Institutes of Health (NIH) and Collaborative Institutional Training Initiative (CITI), specifically addressing human subject protection protocols. Institutional review board approval was waived due to the anonymized nature of the dataset, which excludes protected health identifiers.
Study design and population
Our analysis included 94,458 patients admitted to the ICU for the first time. We excluded patients based on the following criteria: (1) ICU stay < 2 hours; (2) lack of HbA1c data within 90 days of admission or fasting glucose data within 24 hours of admission; (3) no invasive ventilation during admission; (4) no diagnosis of coronary heart disease (CHD) at admission; and (5) incomplete BMI data. Ultimately, 1,038 patients met the inclusion criteria and were divided into four groups based on SHR quartiles (Figure 1).
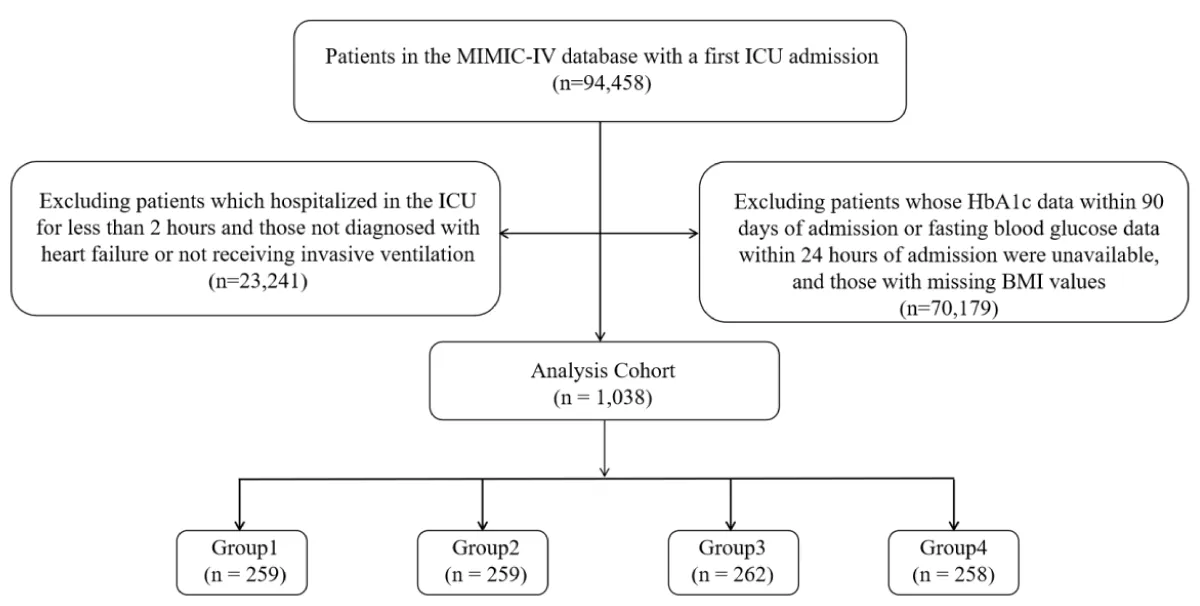
Figure 1: Flow of included patients through the trial.
Data extraction
Data extraction was performed using Navicat Premium (Version 16.1.15) and SQL. This study examined a variety of variables, which were classified as follows:
Study outcomes
The primary outcomes of this study are the 30-day mortality (death within 30 days after discharge) and the all-cause mortality rate in the Intensive Care Unit (ICU). The secondary outcomes are the 365-day mortality (death within 365 days after discharge) and the all-cause mortality rate during hospitalization.
Calculation of SHR
SHR was calculated using the formula: [Admission glucose (mg/dL)] / [28.7 × HbA1c (%) -46.7]. Admission glucose and HbA1c data were directly extracted from the MIMIC-IV database.
Statistical analysis
Firstly, the Wilcoxon rank-sum test was used for continuous variables, and the results were presented as the median and interquartile range (IQR). For categorical variables, the chi-square test or Fisher’s exact test was applied, and the results were expressed as absolute numbers and percentages.
The Kaplan-Meier (KM) curve was used to determine the incidence of primary and secondary outcomes, and stratification was performed according to the quartiles of the SHR index. Univariate Cox analysis was used to evaluate the relationship between the SHR index and 30-day, 365-day, ICU, and hospital all-cause mortality. A multivariate Cox proportional-hazards regression model was constructed by including clinically relevant variables or those with a univariate relationship with the outcomes. Model 1 included sex, age, and BMI, while Model 2 was adjusted for sex, age, BMI, CHD, hypertension, diabetes, AF, cancer, AKI stage, PCI, cerebrovascular disease, CABG, WBC, hb, plt, bun, cr, lactate_max, rate, sbp, dbp, resp, temperature, spo2, vasoactive drugs, ACEI, antibiotics, ARB, antiplatelet agents, and statins. In both models, the second quartile (Q2) of the SHR index was used as the reference group. Meanwhile, the SHR index was treated as a continuous variable, and restricted cubic spline (RCS) analysis was used to examine the dose-response relationship between the SHR index and the risk of primary outcomes. If a non-linear relationship was detected, a Cox threshold analysis model was used to determine the inflection point between the SHR index and all-cause mortality.
In addition, subgroup analyses were performed based on gender (male, female), age (25.88 < Q1 ≤ 62.75; 62.75 < Q2 ≤ 74.51; 74.51 < Q3 ≤ 96.3), BMI (13.62 < Q1 ≤ 26.18; 26.03 < Q2 ≤ 32.08; 32.03 < Q3 ≤ 97.43), history of PCI, history of CABG, history of diabetes, history of hypertension, AF, and history of CHD. All statistical analyses were performed using SPSS software (Version 22.0) and R software (Version 4.4.2), with a significance level set at p < 0.05.
Baseline characteristics
This study analyzed the data of 94,458 patients from the MIMIC-IV database, among whom 1,038 patients met the inclusion criteria. The average age of the participants was 68.50 years (range: 59.46 - 77.48 years), and 639 (61.56%) of them were male. According to the quartiles of the stress hyperglycemia ratio (SHR) index at admission, the study participants were divided into four groups: Q1 (≤1.14), Q2 (1.14 < SHR ≤ 1.43), Q3 (1.43 < SHR ≤ 1.87), and Q4 (SHR > 1.87). Table 1 shows the baseline characteristics of these groups. Among the participants in the group with the highest SHR index (Q4), the prevalence rates of cardiac surgery, percutaneous coronary intervention (PCI), diabetes, myocardial infarction, and Coronary Heart Disease (CHD) were higher. Meanwhile, the probabilities of using vasoactive drugs, dopamine, dobutamine, epinephrine, norepinephrine, and vasopressin were also higher. Compared with the other groups, their levels of hemoglobin (hb), white blood cells (wbc), anion gap (agap), blood urea nitrogen (bun), creatinine (cr), blood glucose (glu), potassium (k), alanine aminotransferase (alt), aspartate aminotransferase (ast), maximum lactate value (lactate max), Sequential Organ Failure Assessment (SOFA) score, Simplified Acute Physiology Score II (SAPSII), Oxford Acute Disease Severity Score (OASIS), heart rate (rate), and respiratory rate (resp) were higher. The mortality rate of the Q4 group at the 30-day time point when discharged from the hospital was significantly higher than that of the other groups: the 30-day mortality rate (20.46% vs. 20.85% vs. 22.90% vs. 29.84%, p = 0.04). Similarly, the ICU mortality rate of the Q4 group was significantly higher than that of the other groups (12.36% vs. 9.27% vs. 15.27% vs. 20.16%, p < 0.01).
| Table 1: Baseline characteristics of patients grouped according to SHR index quartiles. | ||||||
| Variable | Total (n = 1038) |
Q1 (n = 259) |
Q2 (n = 259) |
Q3 (n = 262) |
Q4 (n = 258) |
p. value |
| sex | 0.96 | |||||
| Female | 399(38.44) | 101(39.00) | 96(37.07) | 103(39.31) | 99(38.37) | |
| Male | 639(61.56) | 158(61.00) | 163(62.93) | 159(60.69) | 159(61.63) | |
| age | 68.50(59.46,77.48) | 70.22(60.32,78.48) | 68.66(60.21,79.07) | 69.24(59.72,77.74) | 66.55(57.82,74.69) | 0.13 |
| los_hospital_day | 20.02 ± 18.92 | 20.24 ± 15.60 | 21.13 ± 17.88 | 20.57 ± 24.26 | 18.12 ± 16.62 | 0.29 |
| death_hosp_yn | 0.30 | |||||
| alive | 825(79.48) | 213(82.24) | 210(81.08) | 206(78.63) | 196(75.97) | |
| death | 213(20.52) | 46(17.76) | 49(18.92) | 56(21.37) | 62(24.03) | |
| death_icu_yn | <0.01 | |||||
| alive | 890(85.74) | 227(87.64) | 235(90.73) | 222(84.73) | 206(79.84) | |
| death | 148(14.26) | 32(12.36) | 24( 9.27) | 40(15.27) | 52(20.16) | |
| hadm_status_yn_30 | 0.04 | |||||
| alive | 794(76.49) | 206(79.54) | 205(79.15) | 202(77.10) | 181(70.16) | |
| death | 244(23.51) | 53(20.46) | 54(20.85) | 60(22.90) | 77(29.84) | |
| hadm_status_yn_90 | 0.56 | |||||
| alive | 728(70.13) | 186(71.81) | 183(70.66) | 187(71.37) | 172(66.67) | |
| death | 310(29.87) | 73(28.19) | 76(29.34) | 75(28.63) | 86(33.33) | |
| hadm_status_yn_180 | 0.84 | |||||
| alive | 678(65.32) | 173(66.80) | 171(66.02) | 171(65.27) | 163(63.18) | |
| death | 360(34.68) | 86(33.20) | 88(33.98) | 91(34.73) | 95(36.82) | |
| hadm_status_yn_365 | 0.60 | |||||
| alive | 622(59.92) | 162(62.55) | 159(61.39) | 151(57.63) | 150(58.14) | |
| death | 416(40.08) | 97(37.45) | 100(38.61) | 111(42.37) | 108(41.86) | |
| BMI | 29.21(24.91,34.60) | 29.72(25.07,35.89) | 29.20(24.52,33.86) | 29.38(25.08,35.24) | 28.59(24.71,33.83) | 0.42 |
| height | 1.70(1.63,1.78) | 1.70(1.63,1.78) | 1.70(1.63,1.78) | 1.70(1.63,1.78) | 1.70(1.63,1.78) | 0.88 |
| weight | 84.30(70.00,102.89) | 86.60(69.75,104.13) | 84.20(70.93,101.23) | 83.28(70.25,105.33) | 83.50(70.00,99.68) | 0.44 |
| Cardiac_surgery | 0.04 | |||||
| no | 687(66.18) | 172(66.41) | 176(67.95) | 186(70.99) | 153(59.30) | |
| yes | 351(33.82) | 87(33.59) | 83(32.05) | 76(29.01) | 105(40.70) | |
| PCI | <0.001 | |||||
| no | 925(89.11) | 240(92.66) | 238(91.89) | 235(89.69) | 212(82.17) | |
| yes | 113(10.89) | 19( 7.34) | 21( 8.11) | 27(10.31) | 46(17.83) | |
| CABG | 0.42 | |||||
| no | 933(89.88) | 227(87.64) | 234(90.35) | 241(91.98) | 231(89.53) | |
| yes | 105(10.12) | 32(12.36) | 25( 9.65) | 21( 8.02) | 27(10.47) | |
| hct | 36.20(31.00,41.60) | 34.90(30.30,39.90) | 36.10(30.85,41.90) | 36.95(31.25,41.45) | 36.60(31.63,42.70) | 0.07 |
| hb | 11.60(9.80,13.48) | 11.20(9.55,13.05) | 11.60(9.80,13.70) | 11.70(9.80,13.30) | 12.00(10.30,13.60) | 0.03 |
| plt | 227.00(170.25,290.75) | 218.00(160.50,283.50) | 215.00(161.50,279.00) | 246.00(186.25,309.75) | 230.00(177.50,291.75) | <0.001 |
| wbc | 14.40(10.80,19.10) | 12.60(9.40,17.00) | 13.40(10.45,17.30) | 15.05(11.43,19.33) | 16.80(13.20,22.70) | <0.0001 |
| agap | 18.01 ± 5.27 | 15.97 ± 4.06 | 17.22 ± 4.94 | 18.25 ± 4.81 | 20.62 ± 5.99 | <0.0001 |
| bun | 30.00(21.00,50.00) | 30.00(20.00,46.50) | 29.00(20.00,48.50) | 29.00(21.00,48.75) | 33.00(24.00,55.75) | 0.02 |
| cr | 1.50(1.10,2.50) | 1.30(1.00,2.00) | 1.40(1.10,2.30) | 1.55(1.10,2.50) | 1.90(1.20,2.80) | <0.0001 |
| glu | 191.00(145.00,271.75) | 125.00(109.00,155.00) | 164.00(142.50,198.50) | 205.00(176.25,255.00) | 332.50(259.25,443.50) | <0.0001 |
| na | 140.00(137.00,143.00) | 140.00(137.00,143.50) | 140.00(137.00,143.00) | 140.00(137.00,143.00) | 140.00(137.00,144.00) | 0.49 |
| k | 4.70(4.20,5.38) | 4.50(4.00,5.10) | 4.60(4.20,5.20) | 4.70(4.20,5.50) | 5.00(4.50,5.70) | <0.0001 |
| alt | 38.00(20.00,88.75) | 29.00(17.50,59.80) | 36.00(21.00,69.50) | 35.50(19.00,75.75) | 59.50(25.00,191.45) | <0.0001 |
| alp | 90.10(68.00,125.00) | 90.00(69.00,120.00) | 93.00(68.00,129.00) | 88.00(68.25,122.00) | 94.00(67.00,131.50) | 0.97 |
| ast | 65.00(32.00,168.00) | 49.00(28.00,99.30) | 66.00(30.00,142.50) | 59.00(32.00,126.05) | 118.00(42.25,412.00) | <0.0001 |
| PCO2_mmHg_max | 50.00(43.00,59.00) | 50.00(42.00,57.80) | 50.00(42.00,58.00) | 50.00(43.00,57.75) | 51.00(45.00,62.00) | 0.24 |
| lactate_max | 2.20(1.56,4.00) | 1.80(1.30,2.59) | 1.98(1.40,2.80) | 2.20(1.60,3.90) | 3.70(2.21,7.18) | <0.0001 |
| PaO2FiO2ratio_min | 134.29(80.00,216.60) | 154.00(98.33,230.30) | 149.20(90.86,225.30) | 133.14(82.20,218.66) | 100.00(63.50,177.50) | <0.0001 |
| ph_min | 7.29(7.20,7.36) | 7.32(7.26,7.38) | 7.31(7.25,7.37) | 7.28(7.20,7.36) | 7.22(7.13,7.30) | <0.0001 |
| baseexcess_mEq.L_min | -3.00(-8.00,0.00) | -0.60(-4.00,1.00) | -1.60(-5.20,1.00) | -4.00(-8.00,0.00) | -8.00(-12.00,-3.85) | <0.0001 |
| vasoactive | <0.01 | |||||
| no | 563(54.24) | 156(60.23) | 149(57.53) | 141(53.82) | 117(45.35) | |
| yes | 475(45.76) | 103(39.77) | 110(42.47) | 121(46.18) | 141(54.65) | |
| dopamine | 0.03 | |||||
| no | 971(93.55) | 245(94.59) | 247(95.37) | 248(94.66) | 231(89.53) | |
| yes | 67( 6.45) | 14( 5.41) | 12( 4.63) | 14( 5.34) | 27(10.47) | |
| dobutamine | 0.02 | |||||
| no | 918(88.44) | 238(91.89) | 233(89.96) | 232(88.55) | 215(83.33) | |
| yes | 120(11.56) | 21( 8.11) | 26(10.04) | 30(11.45) | 43(16.67) | |
| epinephrine | <0.01 | |||||
| no | 955(92.00) | 239(92.28) | 245(94.59) | 246(93.89) | 225(87.21) | |
| yes | 83( 8.00) | 20( 7.72) | 14( 5.41) | 16( 6.11) | 33(12.79) | |
| norepinephrine | <0.0001 | |||||
| no | 673(64.84) | 188(72.59) | 174(67.18) | 172(65.65) | 139(53.88) | |
| yes | 365(35.16) | 71(27.41) | 85(32.82) | 90(34.35) | 119(46.12) | |
| vasopressin | <0.0001 | |||||
| no | 931(89.69) | 240(92.66) | 237(91.51) | 242(92.37) | 212(82.17) | |
| yes | 107(10.31) | 19( 7.34) | 22( 8.49) | 20( 7.63) | 46(17.83) | |
| acei | 0.61 | |||||
| no | 673(64.84) | 176(67.95) | 166(64.09) | 170(64.89) | 161(62.40) | |
| yes | 365(35.16) | 83(32.05) | 93(35.91) | 92(35.11) | 97(37.60) | |
| antibiotic | 0.47 | |||||
| no | 69( 6.65) | 19( 7.34) | 18( 6.95) | 12( 4.58) | 20( 7.75) | |
| yes | 969(93.35) | 240(92.66) | 241(93.05) | 250(95.42) | 238(92.25) | |
| arb | 0.48 | |||||
| no | 891(85.84) | 219(84.56) | 217(83.78) | 230(87.79) | 225(87.21) | |
| yes | 147(14.16) | 40(15.44) | 42(16.22) | 32(12.21) | 33(12.79) | |
| antiplatelet | 0.70 | |||||
| no | 238(22.93) | 56(21.62) | 61(23.55) | 56(21.37) | 65(25.19) | |
| yes | 800(77.07) | 203(78.38) | 198(76.45) | 206(78.63) | 193(74.81) | |
| tating | 0.34 | |||||
| no | 293(28.23) | 65(25.10) | 69(26.64) | 77(29.39) | 82(31.78) | |
| yes | 745(71.77) | 194(74.90) | 190(73.36) | 185(70.61) | 176(68.22) | |
| calcium_channel_blocker | <0.01 | |||||
| no | 914(88.05) | 220(84.94) | 218(84.17) | 233(88.93) | 243(94.19) | |
| yes | 124(11.95) | 39(15.06) | 41(15.83) | 29(11.07) | 15( 5.81) | |
| other_antiarrhythmics | 0.41 | |||||
| no | 702(67.63) | 182(70.27) | 173(66.80) | 182(69.47) | 165(63.95) | |
| yes | 336(32.37) | 77(29.73) | 86(33.20) | 80(30.53) | 93(36.05) | |
| Hypertension | 1.00 | |||||
| no | 193(18.59) | 49(18.92) | 47(18.15) | 49(18.70) | 48(18.60) | |
| yes | 845(81.41) | 210(81.08) | 212(81.85) | 213(81.30) | 210(81.40) | |
| diabetes | 0.06 | |||||
| no | 471(45.38) | 122(47.10) | 130(50.19) | 119(45.42) | 100(38.76) | |
| yes | 567(54.62) | 137(52.90) | 129(49.81) | 143(54.58) | 158(61.24) | |
| Cerebrovascular.disease | 0.02 | |||||
| no | 728(70.13) | 172(66.41) | 171(66.02) | 186(70.99) | 199(77.13) | |
| yes | 310(29.87) | 87(33.59) | 88(33.98) | 76(29.01) | 59(22.87) | |
| AF | 0.07 | |||||
| no | 533(51.35) | 130(50.19) | 119(45.95) | 136(51.91) | 148(57.36) | |
| yes | 505(48.65) | 129(49.81) | 140(54.05) | 126(48.09) | 110(42.64) | |
| Mild.liver.disease | 0.79 | |||||
| no | 924(89.02) | 234(90.35) | 229(88.42) | 230(87.79) | 231(89.53) | |
| yes | 114(10.98) | 25( 9.65) | 30(11.58) | 32(12.21) | 27(10.47) | |
| ischemic.stroke | <0.01 | |||||
| no | 863(83.14) | 210(81.08) | 202(77.99) | 219(83.59) | 232(89.92) | |
| yes | 175(16.86) | 49(18.92) | 57(22.01) | 43(16.41) | 26(10.08) | |
| Malignant_cancer | 0.89 | |||||
| no | 972(93.64) | 244(94.21) | 241(93.05) | 247(94.27) | 240(93.02) | |
| yes | 66( 6.36) | 15( 5.79) | 18( 6.95) | 15( 5.73) | 18( 6.98) | |
| Myocardial_infarction | <0.0001 | |||||
| no | 583(56.17) | 168(64.86) | 149(57.53) | 156(59.54) | 110(42.64) | |
| yes | 455(43.83) | 91(35.14) | 110(42.47) | 106(40.46) | 148(57.36) | |
| AKI_stage | 2.21 ± 0.85 | 2.20 ± 0.86 | 2.18 ± 0.85 | 2.16 ± 0.89 | 2.30 ± 0.79 | 0.22 |
| CHD | <0.01 | |||||
| no | 379(36.51) | 107(41.31) | 106(40.93) | 97(37.02) | 69(26.74) | |
| yes | 659(63.49) | 152(58.69) | 153(59.07) | 165(62.98) | 189(73.26) | |
| sofa | 7.00(4.00,9.00) | 6.00(3.50,8.00) | 6.00(4.00,9.00) | 6.00(4.00,9.00) | 8.00(5.00,10.00) | <0.0001 |
| sapsii | 41.00(33.25,51.00) | 39.00(32.00,47.00) | 41.00(33.00,49.00) | 41.50(34.00,51.00) | 46.00(37.00,57.00) | <0.0001 |
| oasis | 37.00(32.00,42.00) | 35.00(30.00,40.00) | 37.00(31.50,43.00) | 37.50(32.00,42.00) | 38.00(33.00,44.00) | <0.0001 |
| sirs | 3.00(2.00,3.00) | 3.00(2.00,3.00) | 3.00(2.00,3.00) | 3.00(2.00,3.00) | 3.00(3.00,4.00) | <0.0001 |
| GCS | 15.00(14.00,15.00) | 15.00(14.00,15.00) | 15.00(13.00,15.00) | 15.00(14.00,15.00) | 15.00(14.00,15.00) | 0.12 |
| CCI | 7.00(5.00,9.00) | 7.00(5.00,9.00) | 7.00(5.00,9.00) | 7.00(5.00,8.00) | 7.00(5.00,9.00) | 0.73 |
| rate | 83.82(72.87,96.00) | 80.33(71.23,91.99) | 83.89(73.34,97.55) | 85.41(74.11,95.88) | 86.31(74.61,99.01) | <0.01 |
| sbp | 112.37(103.69,123.90) | 113.97(104.60,126.90) | 112.93(103.49,123.47) | 112.37(105.63,123.90) | 110.50(101.18,121.31) | 0.02 |
| dbp | 61.96(55.08,68.93) | 61.03(55.02,68.55) | 62.35(54.82,69.00) | 61.92(54.46,68.38) | 62.58(55.54,69.53) | 0.48 |
| mbp | 76.79(71.35,83.85) | 76.55(70.00,83.97) | 76.76(71.40,84.00) | 76.29(71.75,83.08) | 77.92(72.12,84.96) | 0.66 |
| resp | 20.07(17.91,22.94) | 19.50(17.84,22.00) | 19.92(17.56,21.87) | 19.98(17.56,23.03) | 21.37(18.74,24.32) | <0.0001 |
| temperature | 36.94(36.64,37.31) | 36.95(36.64,37.35) | 36.98(36.70,37.35) | 36.96(36.66,37.30) | 36.87(36.53,37.23) | 0.02 |
| spo2 | 97.42(95.92,98.81) | 97.37(95.70,98.40) | 97.27(96.03,98.81) | 97.60(96.38,98.95) | 97.49(95.69,98.88) | 0.13 |
| HAb1cmax | 6.10(5.50,7.10) | 6.20(5.70,7.10) | 6.10(5.60,6.90) | 5.95(5.40,7.10) | 6.00(5.50,7.30) | 0.08 |
| SHR | 1.43(1.14,1.87) | 0.99(0.87,1.07) | 1.28(1.22,1.37) | 1.62(1.52,1.74) | 2.40(2.08,2.95) | <0.0001 |
Results of the Kaplan-Meier curve study
The Kaplan-Meier curves (Figures 2,3) showed that there were differences in the 30-day and ICU mortality rates among the four quartile groups of the SHR. The patients in the group with the highest SHR index (Q4) had significantly higher 30-day and ICU mortality rates compared to those in the groups with lower SHR indices (log-rank p < 0.05). However, there were no significant differences in the survival rates regarding the 365-day and in-hospital mortality rates among the four quartile groups of the SHR (log-rank test, p > 0.05) (Figures S1,S2).
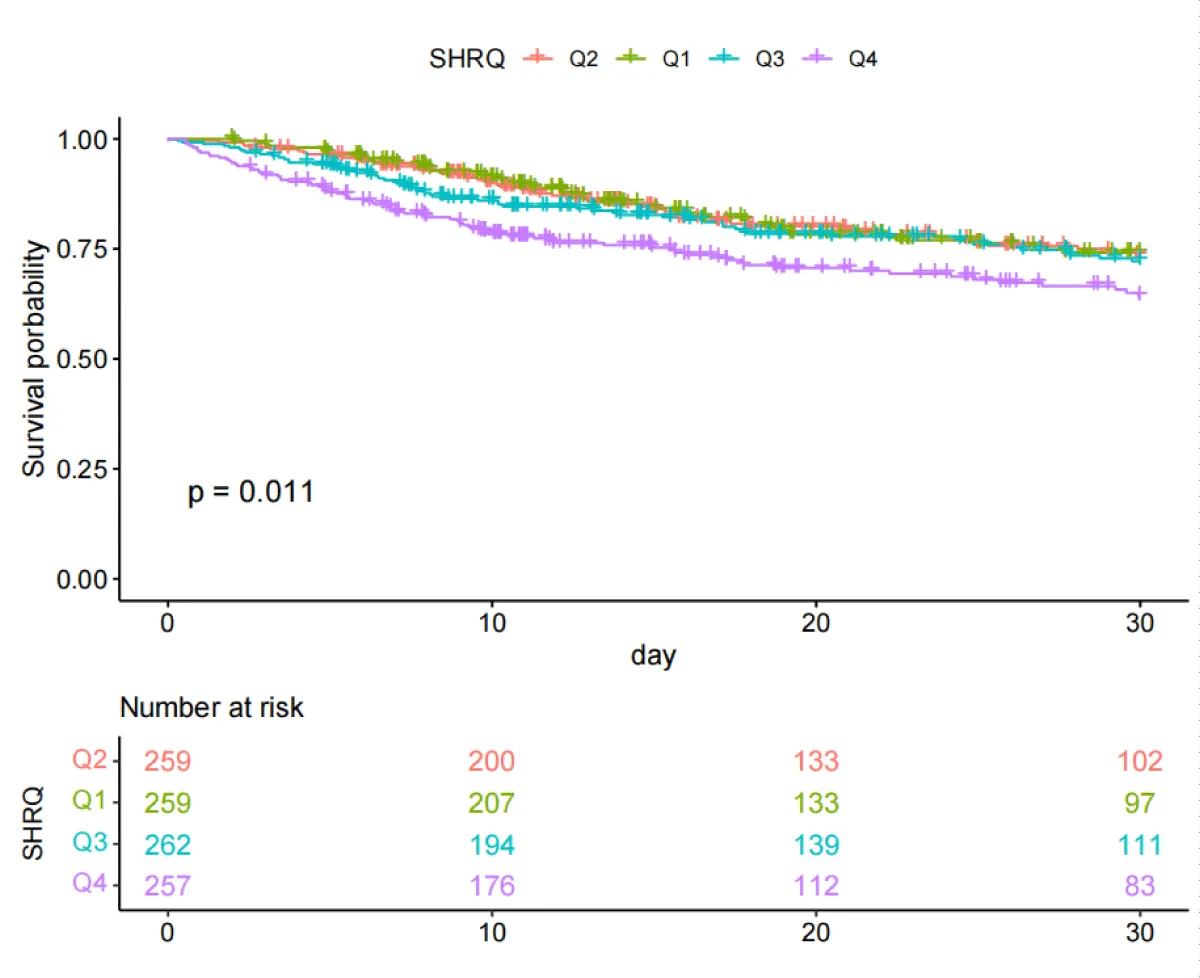
Figure 2: Kaplan-Meier survival analysis curves for all-cause mortality with 30-day.
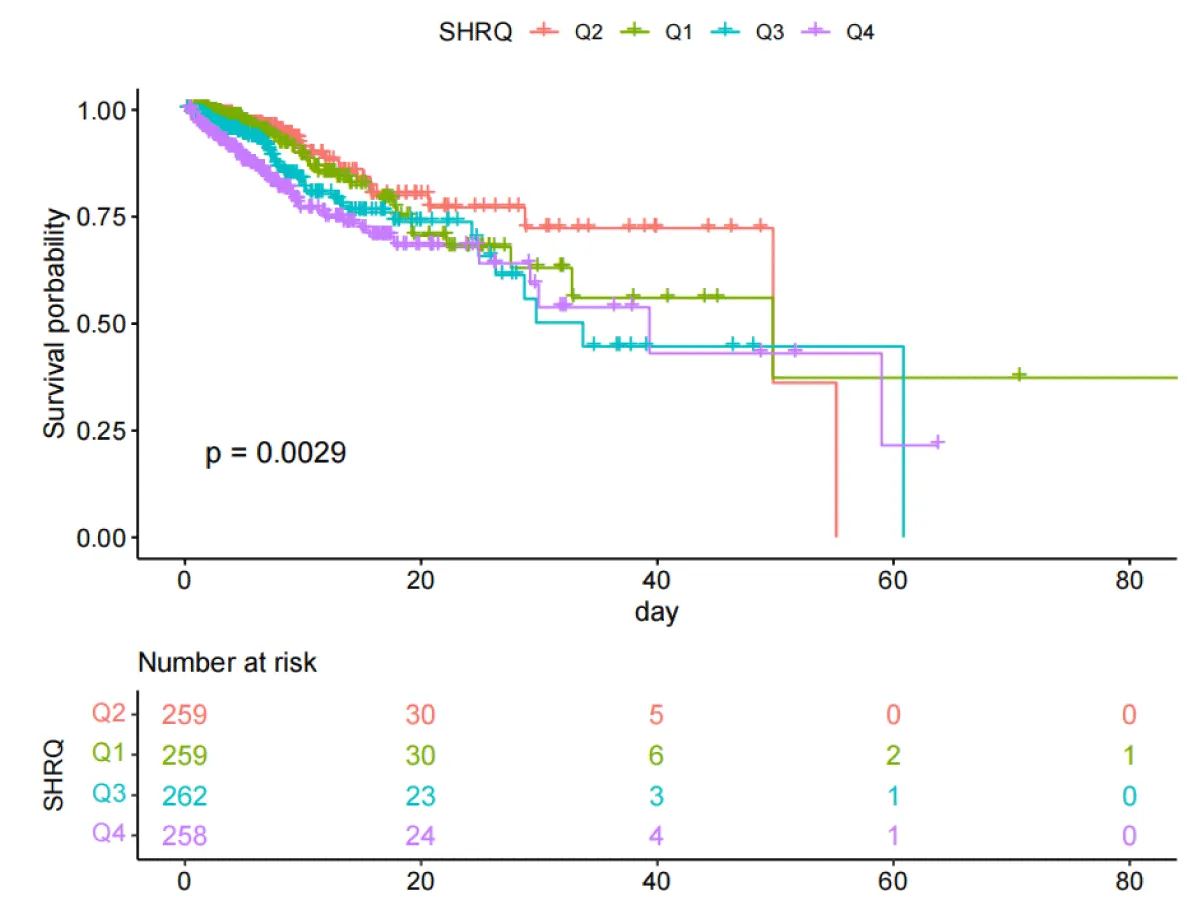
Figure 3: Kaplan-Meier survival analysis curves for all-cause mortality during ICU stay.
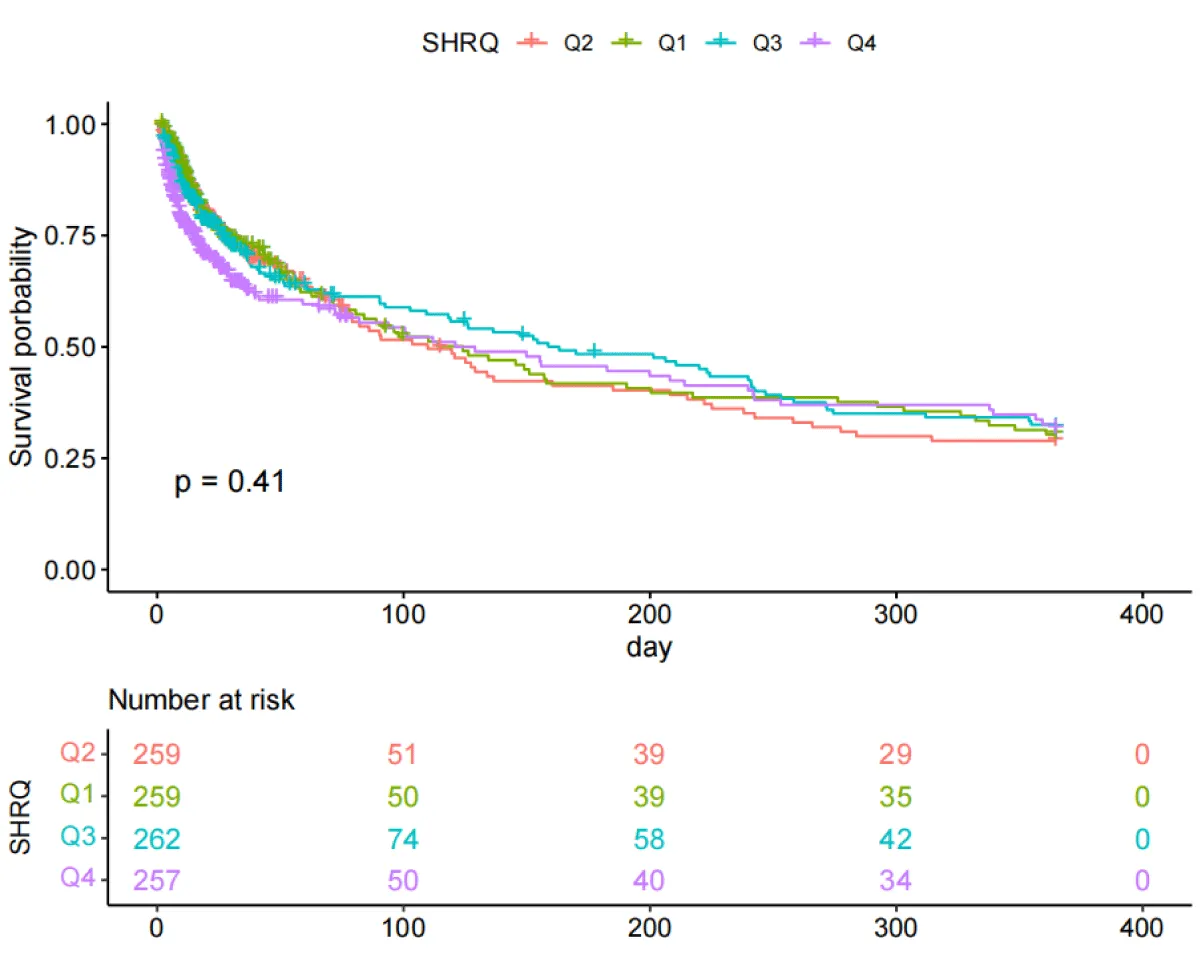
Figure S1: Kaplan-Meier survival analysis curves for all-cause mortality with 365-day.
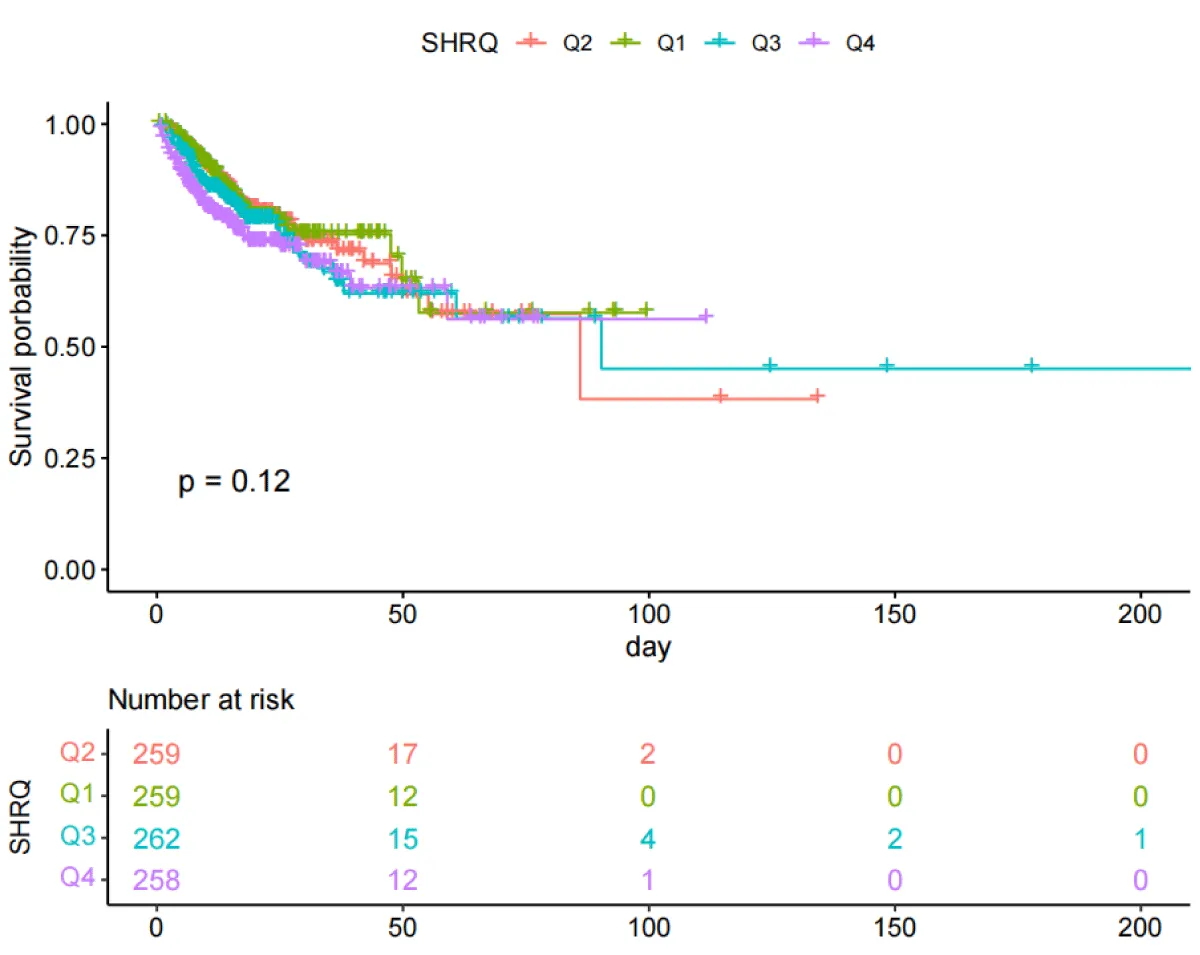
Figure S2: Kaplan-Meier survival analysis curves for all-cause mortality during hospitalization.
Association between SHR and clinical outcomes
To investigate the independent impact of the SHR index on mortality, two Cox regression models were employed, as shown in Tables 2,3. After adjusting for sex, age, and BMI (Model 2), using the second quartile group Q2 as the reference value, the hazard ratios (HRs) and 95% confidence intervals (CIs) for the SHR index categories Q1 (≤1.14), Q2 (1.14 < SHR ≤ 1.43), Q3 (1.43 < SHR ≤ 1.87), and Q4 (SHR > 1.87) were as follows: After adjusting in Model 3, the HRs for 30-day all-cause mortality were 1.02 (0.69, 1.51), 1.00 (reference), 1.22 (0.83, 1.78), and 1.61 (1.10, 2.35) respectively, and the HRs for ICU all-cause mortality were 1.12 (0.64, 1.95), 1.00 (reference), 1.62 (0.95, 2.75), and 1.86 (1.10, 3.14) respectively. Moreover, a significant trend was found in both cases (p for trend < 0.05). The results indicated that as the SHR index increased, the risk of 30-day and ICU all-cause mortality was higher. However, after controlling for potential confounding variables according to Model 3, no significant correlation was found between the SHR index and 365-day and in-hospital all-cause mortality (Tables S1,S2).
| Table2: Cox proportional hazard models for 30-day all-cause mortality. | ||||||
| Character | Model 1 | Model 2 | Model 3 | |||
| 95%CI | p | 95%CI | p | 95%CI | p | |
| SHR | 1.08(1.04,1.13) | <0.001 | 1.05(0.99,1.11) | 0.10 | 1.06(0.99,1.13) | 0.12 |
| Q2 | ref | ref | ref | |||
| Q1 | 0.97(0.67,1.42) | 0.89 | 1(0.68,1.46) | 0.99 | 1.02(0.69,1.51) | 0.92 |
| Q3 | 1.12(0.77,1.61) | 0.56 | 1.18(0.81,1.70) | 0.39 | 1.22(0.83,1.78) | 0.31 |
| Q4 | 1.61(1.14,2.28) | 0.01 | 1.76(1.24,2.50) | 0.002 | 1.61(1.10,2.35) | 0.01 |
| p for trend(Median value) | 0.001 | <0.001 | 0.01 | |||
| HR: Hazard Ratio, CI: Confidence Interval Model 1: Crude Model 2: Sex, Age, BMI Model 3: Sex, age, BMI, CHD, Hypertension, diabetes, AF, Malignant_cancer, AKI_stage, PCI, Cerebrovascular.disease, CABG, wbc, hb, plt, bun, cr, lactate_max, rate, sbp, dbp, resp, temperature, spo2, vasoactive, acei, antibiotic, arb, antiplatelet, tating |
||||||
| Table 3: Cox proportional hazard models for all-cause mortality during ICU stay. | ||||||
| Character | Crude model | Model 1 | Model 2 | |||
| 95%CI | p | 95%CI | p | 95%CI | p | |
| SHR | 1.1(1.02,1.19) | 0.02 | 1.1(1.02,1.19) | 0.02 | 1.12(1.01,1.24) | 0.03 |
| Q2 | ref | ref | ref | |||
| Q1 | 1.27(0.75,2.16) | 0.38 | 1.18(0.69,2.01) | 0.54 | 1.12(0.64,1.95) | 0.69 |
| Q3 | 1.8(1.08,2.98) | 0.02 | 1.79(1.08,2.97) | 0.02 | 1.62(0.95,2.75) | 0.07 |
| Q4 | 2.25(1.39,3.65) | 0.001 | 2.28(1.40,3.71) | <0.001 | 1.86(1.10,3.14) | 0.02 |
| p for trend(Median value) | <0.001 | <0.001 | 0.01 | |||
| HR: Hazard Ratio, CI: Confidence Interval Model 1: Crude Model 2: Sex, Age, BMI Model 3: Sex, age, BMI, CHD, Hypertension, diabetes, AF, Malignant_cancer, AKI_stage, PCI, Cerebrovascular.disease, CABG, wbc, hb, plt, bun, cr, lactate_max, rate, sbp, dbp, resp, temperature, spo2, vasoactive, acei, antibiotic, arb, antiplatelet, tating |
||||||
| TableS1: Cox proportional hazard models for 365-day all-cause mortality. | ||||||
| Character | Model 1 | Model 2 | Model 3 | |||
| 95%CI | p | 95%CI | p | 95%CI | p | |
| SHR | 1.03(0.96,1.10) | 0.44 | 1.03(0.96,1.09) | 0.45 | 1.04(0.97,1.12) | 0.30 |
| Q2 | ref | ref | ref | |||
| Q1 | 0.96(0.73,1.27) | 0.77 | 1.02(0.77,1.35) | 0.91 | 1.07(0.80,1.43) | 0.67 |
| Q3 | 0.98(0.75,1.28) | 0.87 | 1.05(0.80,1.38) | 0.70 | 1.09(0.83,1.44) | 0.54 |
| Q4 | 1.18(0.90,1.55) | 0.24 | 1.31(0.99,1.72) | 0.06 | 1.3(0.96,1.76) | 0.08 |
| p for trend(Median value) | 0.12 | 0.04 | 0.11 | |||
| HR: Hazard Ratio, CI: Confidence Interval Model 1: Crude Model 2: Sex, Age, BMI Model 3: Sex, age, BMI, CHD, Hypertension, diabetes, AF, Malignant_cancer, AKI_stage, PCI, Cerebrovascular.disease, CABG, wbc, hb, plt, bun, cr, lactate_max, rate, sbp, dbp, resp, temperature, spo2, vasoactive, acei, antibiotic, arb, antiplatelet, tating |
||||||
| Table S2: Cox proportional hazard models for all-cause mortality during hospitalization. | ||||||
| Character | Model 1 | Model 2 | Model 3 | |||
| 95%CI | p | 95%CI | p | 95%CI | p | |
| SHR | 1.02(0.95,1.10) | 0.54 | 1.02(0.95,1.10) | 0.59 | 1.01(0.92,1.12) | 0.77 |
| Q2 | ref | ref | ref | |||
| Q1 | 0.95(0.64,1.42) | 0.81 | 0.92(0.62,1.38) | 0.69 | 0.94(0.62,1.43) | 0.78 |
| Q3 | 1.2(0.82,1.76) | 0.35 | 1.22(0.83,1.80) | 0.30 | 1.31(0.88,1.95) | 0.18 |
| Q4 | 1.44(0.99,2.10) | 0.06 | 1.52(1.04,2.21) | 0.03 | 1.24(0.83,1.87) | 0.30 |
| p for trend(Median value) | 0.02 | 0.005 | 0.15 | |||
| HR: Hazard Ratio, CI: Confidence Interval Model 1: Crude Model 2: Sex, Age, BMI Model 3: Sex, age, BMI, CHD, Hypertension, diabetes, AF, Malignant_cancer, AKI_stage, PCI, Cerebrovascular.disease, CABG, wbc, hb, plt, bun, cr, lactate_max, rate, sbp, dbp, resp, temperature, spo2, vasoactive, acei, antibiotic, arb, antiplatelet, tating |
||||||
| Table S3: Threshold effect analysis of SHR index on 30-day allcause mortality. | |||
| Variable | Model1 | Model2 | Model3 |
| standard cox regression | 1.081(1.038,1.126) <0.001 | 1.049(0.991,1.110) 0.097 | 1.058(0.986,1.135) 0.118 |
| Log-likelihood value | -1613.763 | -1587.376 | -1487.846 |
| two-piecewise linear regression | Ip = 1.432 | Ip = 1.432 | Ip = 1.432 |
| Log-likelihood value | -1610.598 | -1583.928 | -1485.786 |
| SHR < IP | 1.272(0.515,3.141) 0.603 | 1.182(0.478,2.919) 0.718 | 0.957(0.354,2.588) 0.931 |
| SHR ≥ IP | 1.02(0.939,1.109) 0.635 | 1.02(0.942,1.105) 0.624 | 1.024(0.920,1.141) 0.663 |
| p for Log-likelihood ratio | 0.042 | 0.032 | 0.127 |
| Model 1: Crude Model 2: Sex, Age, BMI Model 3: Sex, age, BMI, CHD, Hypertension, diabetes, AF, Malignant_cancer, AKI_stage, PCI, Cerebrovascular.disease, CABG, wbc, hb, plt, bun, cr, lactate_max, rate, sbp, dbp, resp, temperature, spo2, vasoactive, acei, antibiotic, arb, antiplatelet, tating |
|||
Restricted cubic spline analysis and threshold effect analysis
As shown in Figure 4, the Restricted Cubic Spline (RCS) curve analysis revealed that there was a non-linear relationship between the SHR index and 30-day all-cause mortality after controlling for potential confounding factors. To further investigate this non-linear relationship, a Cox proportional hazards model and a two-segment Cox proportional hazards model (Table S3) were employed (the log-likelihood ratio of both models, p < 0.05). The analysis determined that the inflection point of the relationship between SHR and all-cause mortality was 1.432.
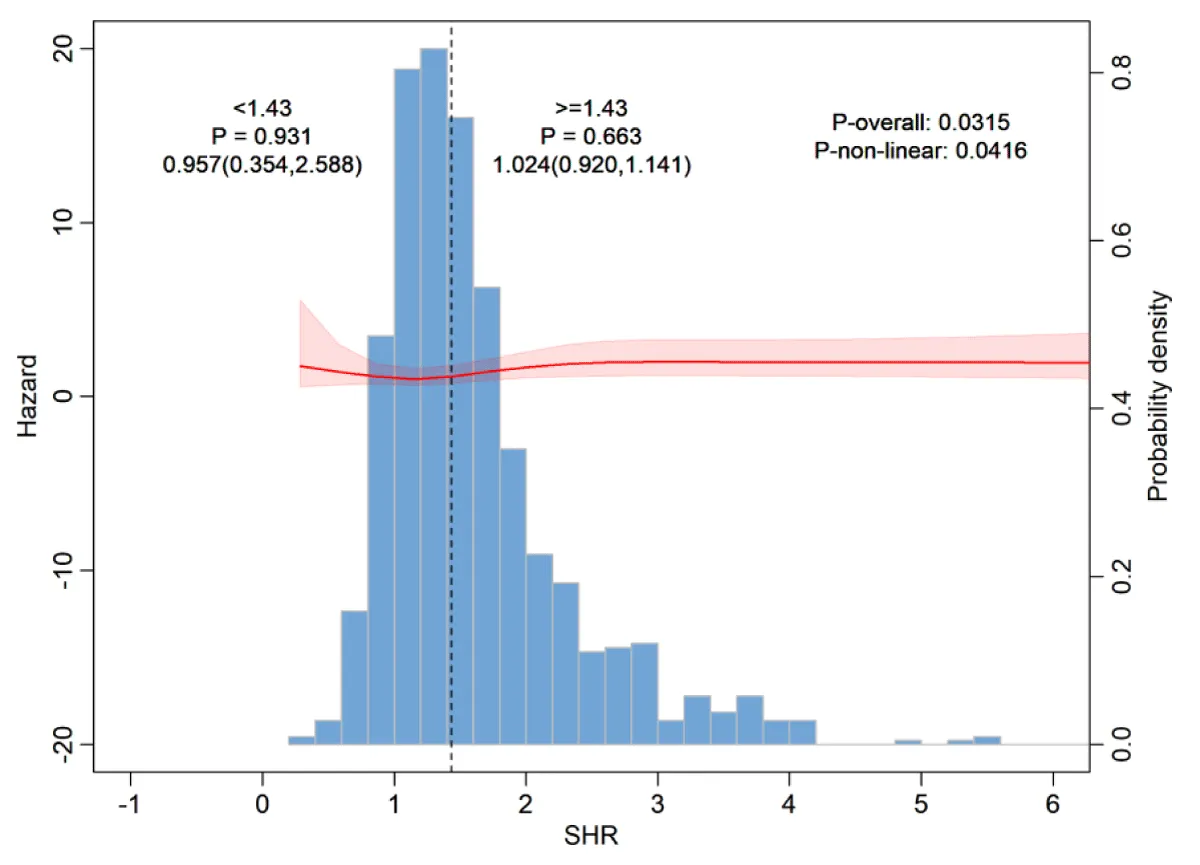
Figure 4: Restricted cubic spline analysis for 30-day all-cause mortality.
Subgroup analysis
As shown in Figures 5-8, to further explore whether the relationship between the SHR level and the all-cause mortality at 30 days and 365 days, as well as the all-cause mortality during the ICU stay and hospitalization, persists under different conditions, subgroup analyses were conducted for gender, age, BMI, diabetes status, PCI, CABG, AF, CHD, and hypertension:
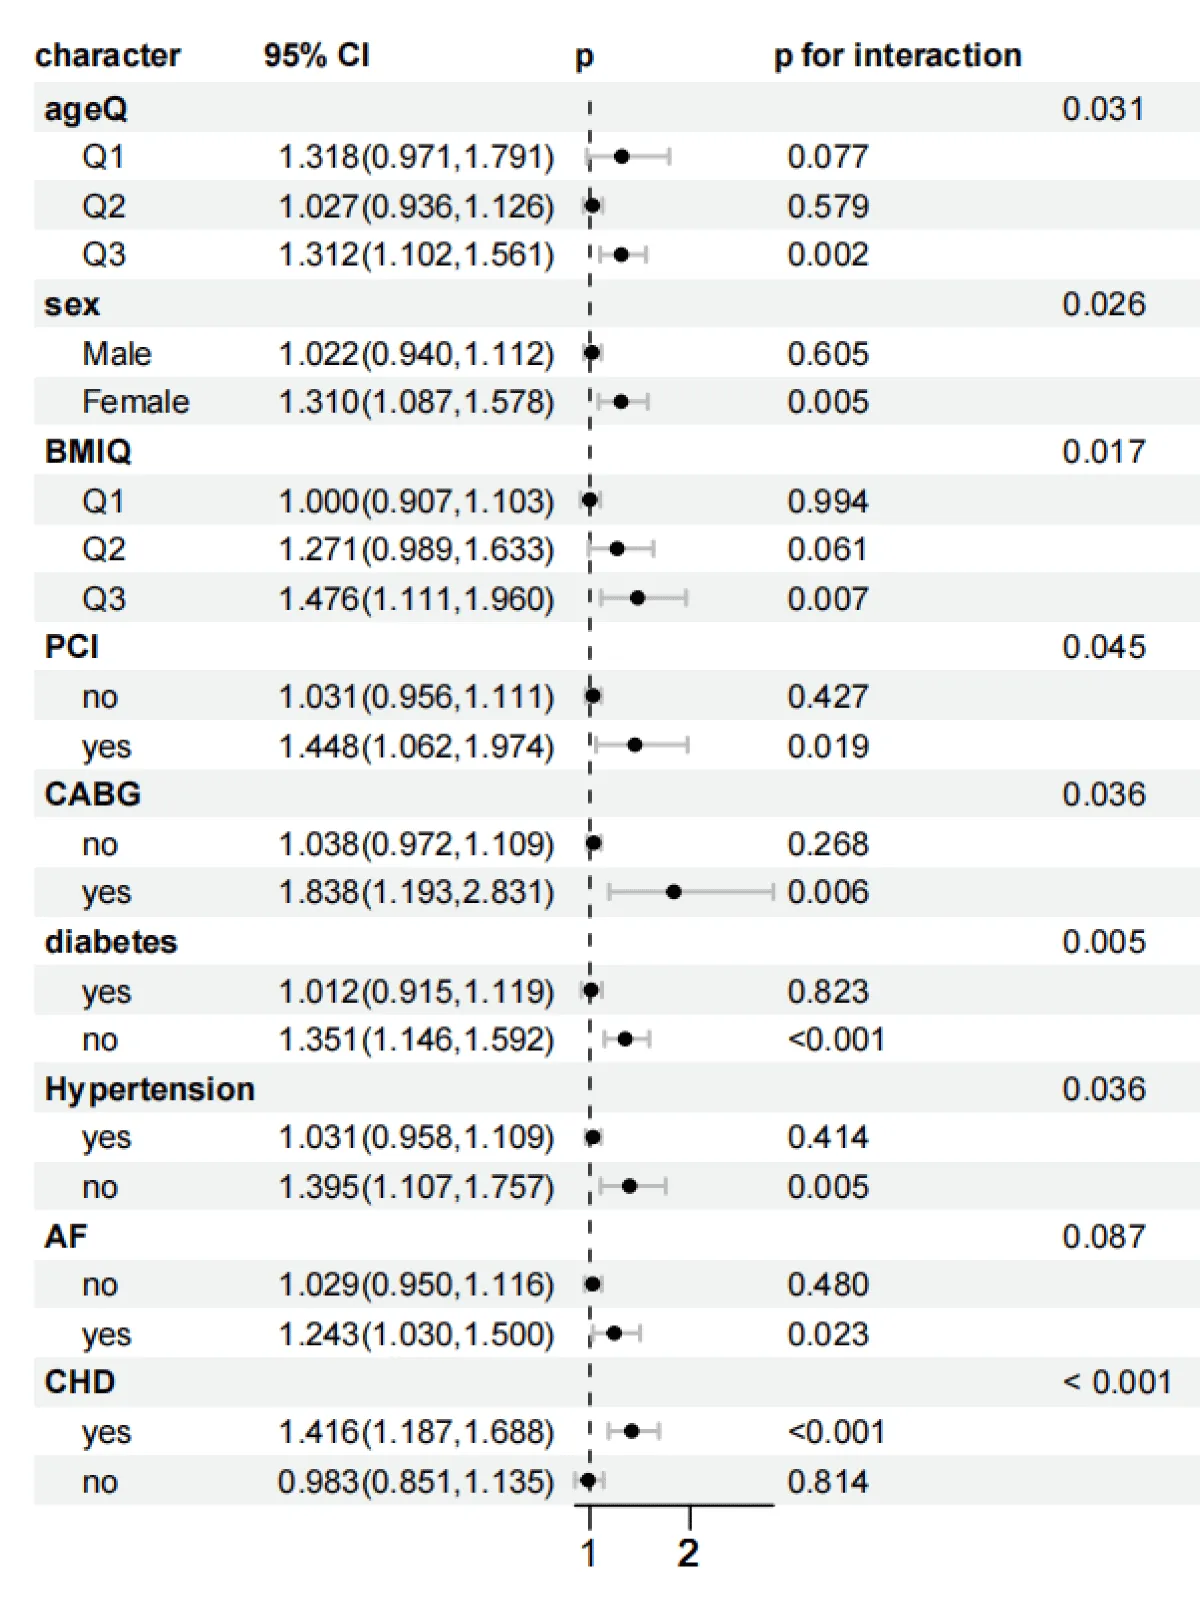
Figure 5: Forest plots of stratified analyses of SHR index and 30-day all-cause mortality. Sex, Age (25.88 < Q1 ≤ 62.75; 62.75 < Q2 ≤ 74.51; 74.51 < Q3 ≤ 96.3), BMI (13.62 < Q1 ≤ 26.18; 26.03 < Q2 ≤ 32.08; 32.03 < Q3 ≤ 97.43), PCI, CABG, diabetes, hypertension, AF, and CHD.
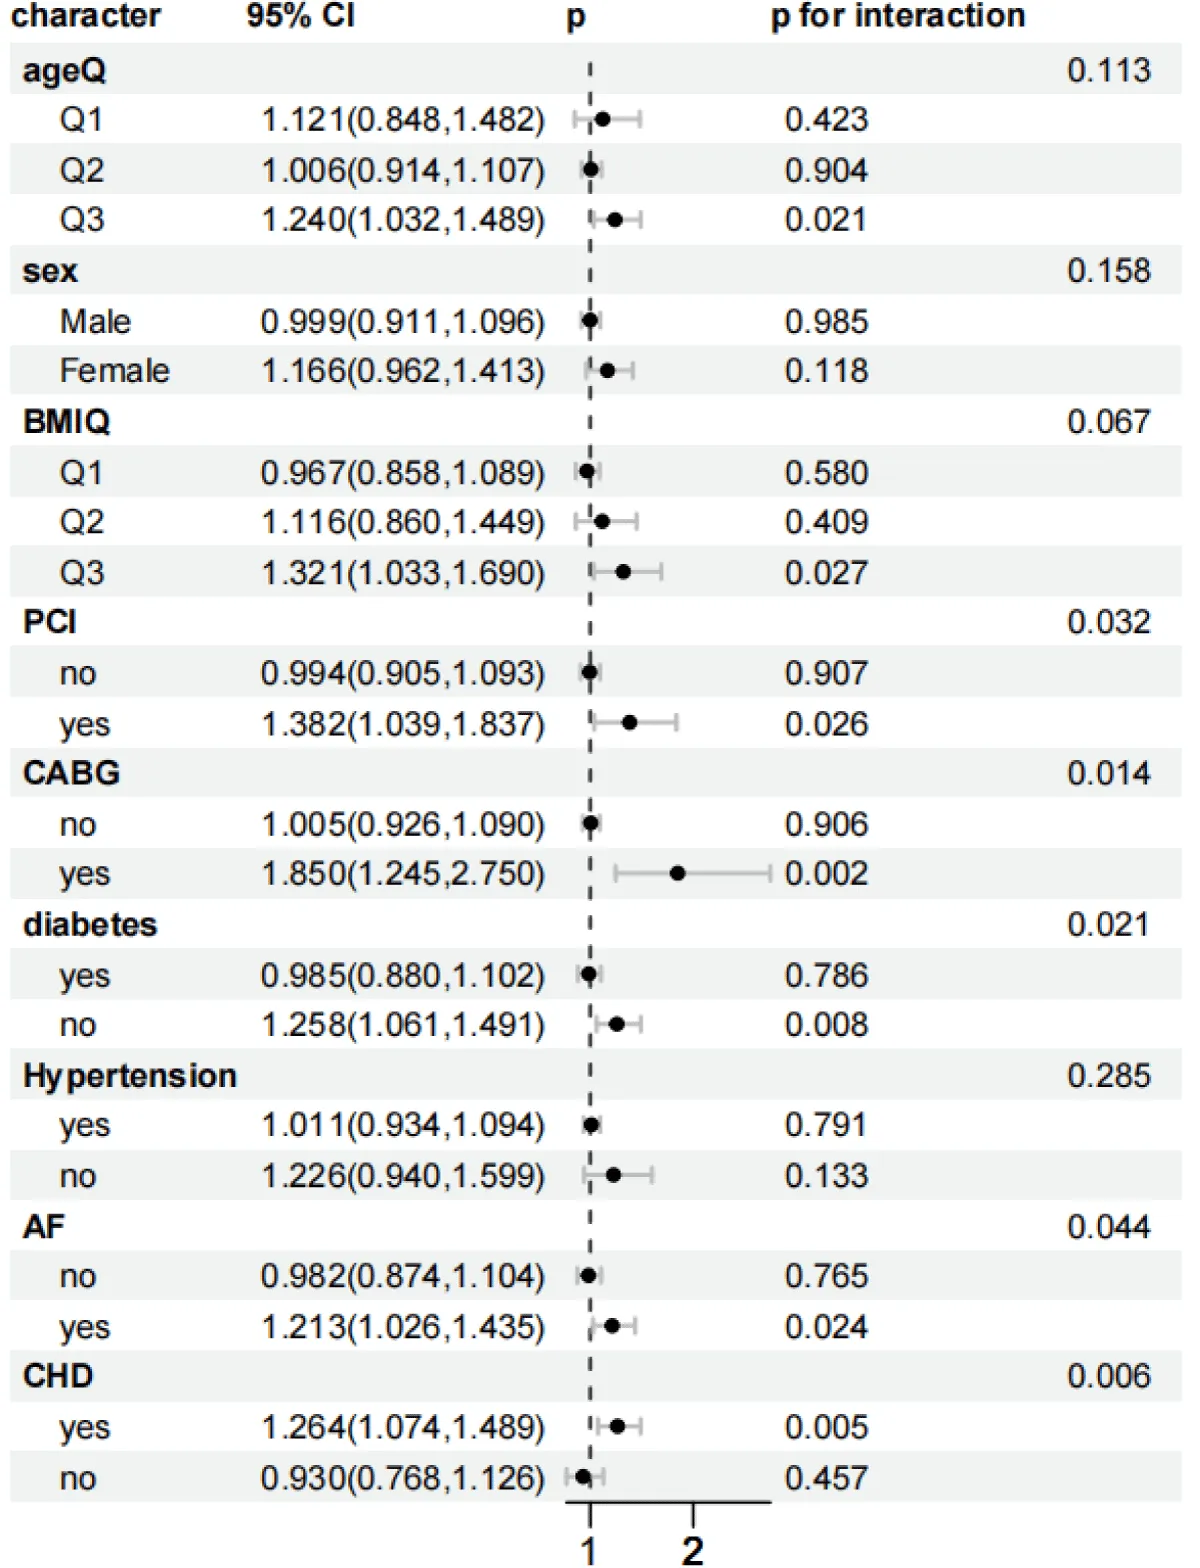
Figure 6: Forest plots of stratified analyses of SHR index and 365-day all-cause mortality. Sex, Age (25.88 < Q1 ≤ 62.75; 62.75 < Q2 ≤ 74.51; 74.51 < Q3 ≤ 96.3), BMI (13.62 < Q1 ≤ 26.18; 26.03 < Q2 ≤ 32.08; 32.03 < Q3 ≤ 97.43), PCI, CABG, diabetes, hypertension, AF, and CHD.
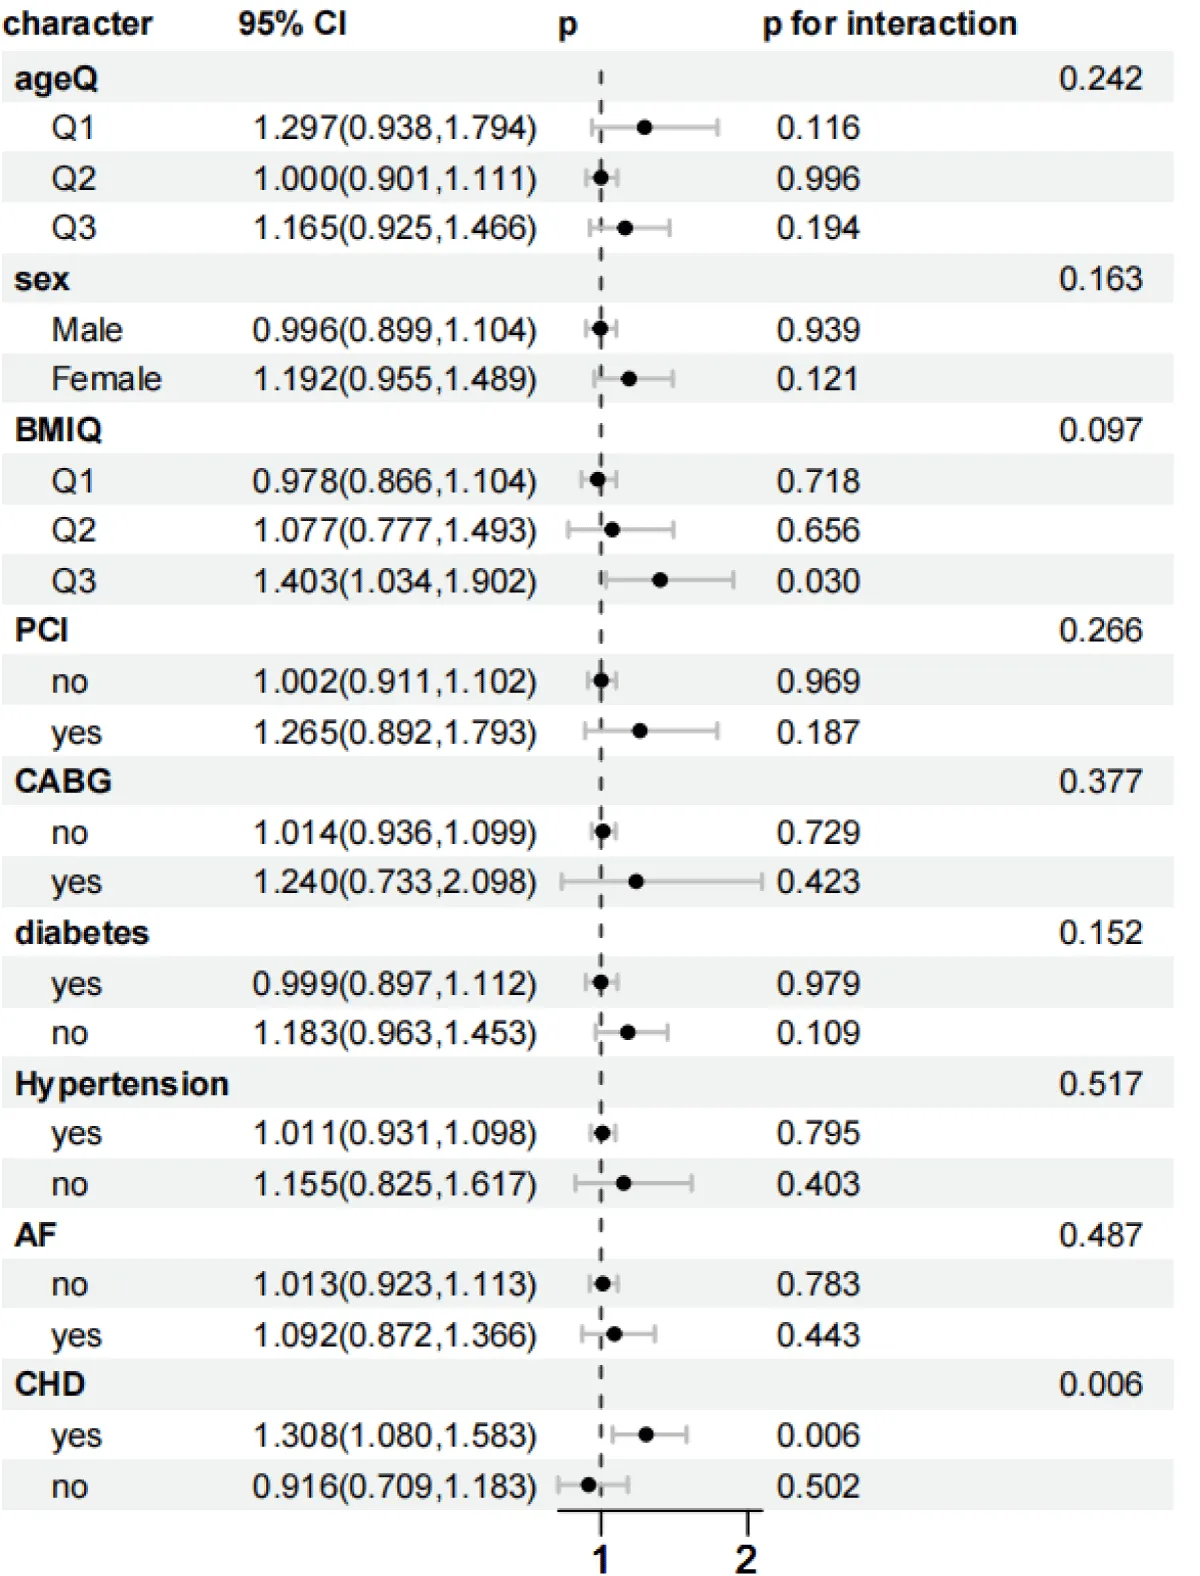
Figure 7: Forest plots of stratified analyses of SHR index and in-hospital all-cause mortality. Sex, Age (25.88 < Q1 ≤ 62.75; 62.75 < Q2 ≤ 74.51; 74.51 < Q3 ≤ 96.3), BMI (13.62 < Q1 ≤ 26.18; 26.03 < Q2 ≤ 32.08; 32.03 < Q3 ≤ 97.43), PCI, CABG, diabetes, hypertension, AF, and CHD.
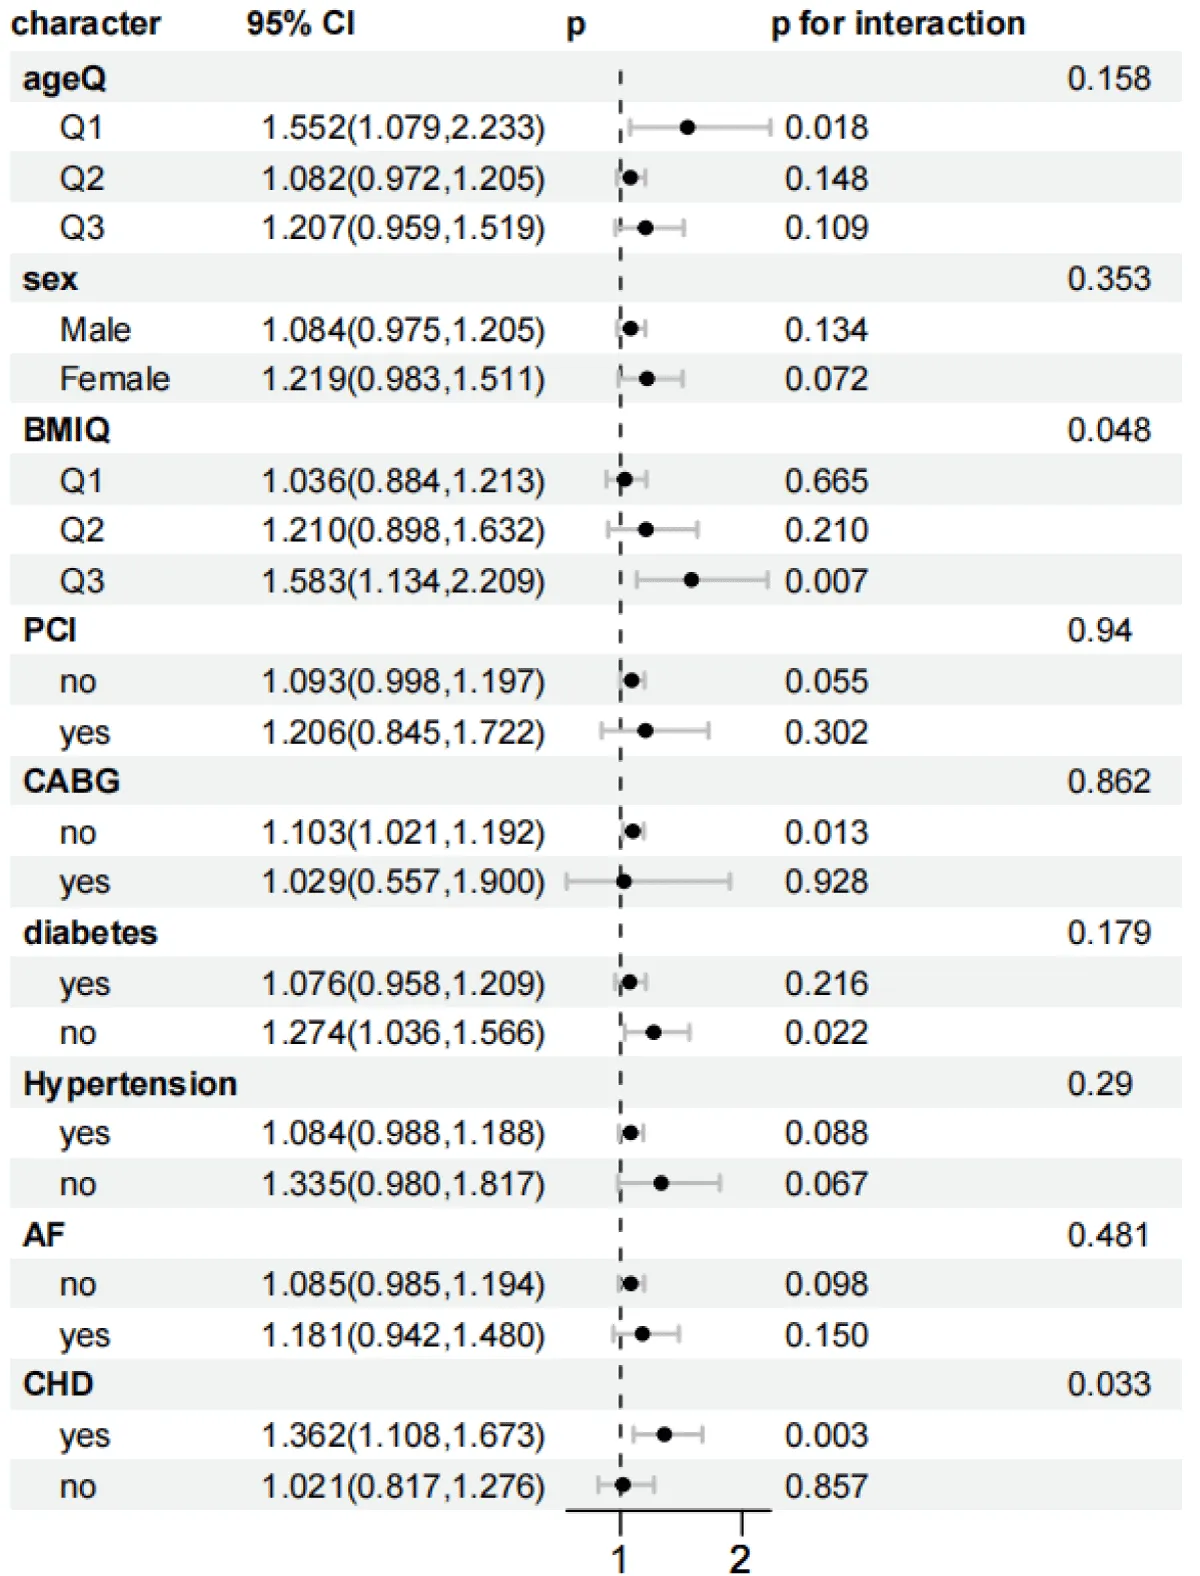
Figure 8: Forest plots of stratified analyses of SHR index and ICU all-cause mortality. Sex, Age (25.88 < Q1 ≤ 62.75; 62.75 < Q2 ≤ 74.51; 74.51 < Q3 ≤ 96.3), BMI (13.62 < Q1 ≤ 26.18; 26.03 < Q2 ≤ 32.08; 32.03 < Q3 ≤ 97.43), PCI, CABG, diabetes, hypertension, AF, and CHD.
In the subgroup analysis of 30-day mortality, stratified by age, for the age group (74.51 < Q3 ≤ 96.3): HR = 1.312 (95% CI 1.102–1.561, p = 0.002). There was an interaction effect with p = 0.031. The risk for females was significantly higher than that for males, and the interaction was significant (p = 0.026). For the obese population (32.03 < Q3 ≤ 97.43): HR = 1.476 (95% CI 1.111–1.960, p = 0.007), and the interaction was significant (p = 0.017). Patients with concurrent Coronary Heart Disease (CHD) had the highest risk (HR = 1.416, 95% CI 1.187–1.688, p < 0.001), and the interaction was extremely significant (p < 0.001). The risk for patients with concurrent atrial fibrillation (AF) was significantly increased (HR = 1.243, 95% CI 1.030–1.500, p < 0.05). The risk for patients after coronary artery bypass grafting (CABG) was significantly increased (HR = 1.838, 95% CI 1.193–2.831, p = 0.006), and the interaction was significant (p = 0.036). Meanwhile, the risk for patients after Percutaneous Coronary Intervention (PCI) was significantly increased (HR = 1.448, 95% CI 1.062–1.974, p = 0.019), and the interaction was significant (p = 0.045). Non-diabetic patients and non-hypertensive patients had higher risks, and the interactions were both significant (p = 0.005).
In the subgroup analysis of ICU mortality, for the obese population (32.03 < Q3 ≤ 97.43): HR = 1.583 (95% CI 1.134–2.209, p = 0.007), and the interaction was significant (p = 0.048). The risk for patients with concurrent Coronary Heart Disease (CHD) was significant, and the interaction was significant (p = 0.033). Non-diabetic patients had a higher risk (HR = 1.274, 95% CI 1.036–1.566, p = 0.022). The risk for patients who did not receive coronary artery bypass grafting (CABG) increased (HR = 1.103, 95% CI 1.021–1.192, p = 0.013), but the interaction was not significant (p = 0.862). In the subgroup analysis of ICU mortality, it remained stable in the subgroups of age, gender, percutaneous coronary intervention (PCI) surgery, hypertension, and atrial fibrillation (AF).
In the subgroup analysis of in-hospital mortality, for the obese population (32.03 < Q3 ≤ 97.43): HR = 1.403 (95% CI 1.034–1.902, p = 0.030), and the interaction did not reach significance (p = 0.097). The risk for patients with concurrent coronary heart disease (CHD) persisted (HR = 1.308, 95% CI 1.080–1.583, p = 0.006), and the interaction was significant (p = 0.006). However, it remained stable in the subgroups of age, gender, percutaneous coronary intervention (PCI) surgery, coronary artery bypass grafting (CABG) surgery, hypertension, diabetes mellitus, and atrial fibrillation (AF).
In the subgroup analysis of 365-day mortality, for the age group (74.51 < Q3 ≤ 96.3): HR = 1.240 (95% CI 1.032–1.489, p = 0.021), and the interaction was not significant (p = 0.113). The risk for patients after coronary artery bypass grafting (CABG) was still significant, and the interaction was significant (p = 0.014). The risks for patients with coronary heart disease (CHD) and non-diabetic patients were significant, and the interactions were both significant (p = 0.006). The risk for patients who received percutaneous coronary intervention (PCI) was significant (HR = 1.382, 95% CI 1.039–1.837, p = 0.026), and the interaction was significant (p = 0.032).In the subgroup analysis of 365-day mortality, it remained stable in the subgroups of gender and hypertension.
This study systematically explored for the first time the predictive value of the stress hyperglycemia ratio (SHR) for the 30-day, 365-day, ICU, and in-hospital all-cause mortality risks in patients with heart failure complicated by tracheal intubation. Moreover, the study used multiple statistical models for analysis (Kaplan-Meier curve, Cox regression, restricted cubic splines, and subgroup analysis). The results of this study found that as the SHR index increased, the 30-day and ICU all-cause mortality risks in patients with heart failure complicated by tracheal intubation increased significantly. The findings of this study are expected to guide treatment methods to reduce the short-term mortality risk of patients with heart failure complicated by tracheal intubation.
Heart failure, as the terminal stage of various cardiovascular diseases, is closely related to its severity and prognosis [11,12]. Epidemiological data show that patients with acute decompensated heart failure need to be admitted to the ICU for invasive ventilation support due to respiratory failure or circulatory collapse, and the in-hospital mortality rate is relatively high [13,14]. Such patients usually have multiple organ failure (such as renal insufficiency and liver dysfunction) [15,16]. In this study, it was found that the Sequential Organ Failure Assessment (SOFA) score and the Simplified Acute Physiology Score II (SAPS II) were significantly increased, which also reflected the severity and complexity of their conditions. It is worth noting that the tracheal intubation rate of patients with heart failure in the ICU is positively correlated with the severity of the disease [17]. Tracheal intubation itself is not only a means of life support but also a sign of severe illness. Intubated patients often face a higher risk of death due to high inflammatory load, hemodynamic instability, and metabolic disorders (such as elevated lactate and electrolyte imbalance) [18,19]. The 1,083 patients included in this study had an average age of 68.50 years, and the proportion of underlying diseases such as Coronary Heart Disease (CHD) and diabetes mellitus was relatively high, further confirming the high-risk characteristics of this population.
This study found that the stress hyperglycemia ratio (SHR) was significantly associated with the short-term (30-day) all-cause mortality rate in patients with heart failure. The hazard ratios (HRs) of the 30-day and ICU all-cause mortality rates in the highest quartile of SHR classification were 1.61 (1.10, 2.35) and 1.86 (1.10, 3.14), respectively. However, there was no significant association with the long-term (365-day) all-cause mortality rate. This indicates that SHR may be an important indicator for evaluating short-term clinical outcomes. Specifically, the 30-day mortality rate in the Q4 group (SHR > 1.87) was significantly higher than that in other groups (29.84% vs. other groups), suggesting that a higher SHR value may indicate a higher short-term mortality risk. This association still existed in the multivariate Cox regression model. Even after adjusting for confounding factors such as gender, age, and Body Mass Index (BMI), SHR was still an independent risk predictor. Previous studies have also found that compared with patients with a lower SHR at baseline, patients with a higher SHR had an increased risk of all-cause death during the follow-up period, and a high SHR was associated with a poor clinical prognosis in patients with heart failure [20]. Yan F, et al. found that an increase in SHR was associated with an increased risk of adverse events, and a higher SHR was significantly associated with an increased risk of 28-day all-cause mortality after discharge and in-hospital mortality in patients with sepsis [21]. This is consistent with our results, and the SHR index is significantly associated with the short-term all-cause mortality rate in patients with heart failure. Moreover, SHR has important value in reflecting metabolic disorders under acute critical conditions, but its impact on long-term survival (such as the 365-day mortality rate) may weaken as the condition stabilizes.
It is worth noting that there is a significant association between SHR and in-ICU mortality, while the mortality rate in the general ward did not show a similar relationship. This means that SHR not only reflects the severity of the disease but is also an important indicator for evaluating critically ill patients, especially those with heart failure who require ICU care. This is consistent with previous research results. SHR is associated with ICU mortality and 1-year all-cause mortality in critically ill patients and has an increasing predictive value in different disease scores. SHR is significantly associated with ICU mortality (HR = 2.92, p < 0.05) [22]. A cohort study also found that the stress hyperglycemia evaluated by SHR was significantly associated with the ICU mortality rate of patients [23]. This is consistent with the conclusion of our study. After adjusting for confounding variables, the HRs of the all-cause mortality rate in the ICU were 1.12 (0.64, 1.95), 1.00 (reference), 1.62 (0.95, 2.75), and 1.86 (1.10, 3.14), respectively. However, there was also no significant correlation between SHR and in-hospital mortality. The possible reason is that compared with the ICU period, the risk of death in the general ward is reduced. This may be because the condition of such patients is not as severe as that of patients who died during the critical period. In addition, during the period when patients are transferred to the inpatient department for treatment, they may receive stricter blood glucose management or multidisciplinary comprehensive treatment, which may alleviate the continuous damage caused by hyperglycemia.
This study revealed a significant association between the Stress Hyperglycemia Ratio (SHR) and the short-term all-cause mortality rate in patients with heart failure who received invasive mechanical ventilation. It is worth noting that glycated hemoglobin (HbA1c) reflects the average blood glucose level over the past 2-3 months and mainly reflects the chronic metabolic state, and it cannot capture the blood glucose fluctuations during the acute stress period. By combining the admission blood glucose (reflecting the acute stress response) with HbA1c (reflecting the chronic metabolic background), SHR can more accurately evaluate the severity of metabolic disorders [24]. For example, in this study, although the HbA1c of patients in the Q4 group may not be significantly abnormal, their admission blood glucose was significantly increased, leading to a significant increase in SHR, thus predicting the short-term mortality risk. Random blood glucose only reflects the blood glucose level at a single time point and is easily affected by factors such as stress and eating. Y-W Su, et al. found that by adjusting the baseline blood glucose level, SHR can more accurately reflect the hyperglycemia level under acute stress conditions, and thus has a greater predictive value than a single blood glucose indicator [25]. Although the significance of SHR in general critical illnesses is gradually becoming clear, there is still a significant gap in the research on SHR in patients with heart failure complicated by invasive ventilation. This study, for the first time, confirmed that SHR has a unique predictive value for critically ill patients with heart failure who received tracheal intubation and provides a basis for optimizing critical care management strategies.
As an indicator of acute metabolic disorders, the association between SHR (stress hyperglycemia ratio) and the short-term mortality risk of patients with heart failure involves complex pathophysiological mechanisms and mainly exerts its effects through the following pathways: A prospective study found that an increase in SHR was associated with the release of pro-inflammatory factors (such as interleukin-6 (IL-6) and tumor necrosis factor-alpha (TNF-α)), which caused inflammation and immune disorders in the human body and further affected the survival outcome of patients [26]. The study by Jay S Skyler, et al. found that patients with heart failure are often in a high-stress state due to low cardiac output, insufficient tissue perfusion, and excessive activation of the sympathetic nervous system. The activation of the sympathetic nervous system promotes the massive release of catecholamines, inhibits insulin secretion, and exacerbates insulin resistance (IR), leading to enhanced gluconeogenesis and increased hepatic glucose output, forming stress hyperglycemia. At the same time, a rapid increase in blood glucose will lead to the generation of a large amount of Reactive Oxygen Species (ROS). Excessive ROS will cause oxidative damage to cardiac cells [27]. In addition, the study by A. Pandolfi, et al. found that by integrating acute blood glucose fluctuations and the chronic glucose metabolism background, SHR can more comprehensively reflect the degree of metabolic disorders in the body [28]. Stress hyperglycemia may lead to a hypercoagulable state of the blood and increase the risk of thrombosis. Affecting the function of platelets, it makes them more likely to aggregate. At the same time, it will also change the activity of coagulation factors, leading to an imbalance in the coagulation system and triggering serious heart diseases such as myocardial infarction [29]. Tracheal intubation, as an important intervention measure for patients with heart failure in the ICU, indicates that the patient’s condition is critical. This study showed that the 30-day and ICU mortality rates of intubated patients were as high as 29.84% and 20.16%, respectively. A retrospective study found that, as a means of life support for patients with severe heart failure, invasive ventilation may further activate the systemic inflammatory response through mechanical stretch and the generation of oxygen-free radicals, which will exacerbate metabolic imbalance [30]. In addition, the cohort study by Zehuo Lin, et al. found that SHR was independently associated with the risks of pulmonary infection and major adverse cardiovascular events (MACE) during hospitalization in patients with ST-segment elevation myocardial infarction (STEMI) who received percutaneous coronary intervention (PCI) treatment, and a higher SHR was associated with a higher incidence of pulmonary infection during hospitalization [31]. A retrospective study also showed that stress hyperglycemia can impair the function of immune cells, increase the incidence of ventilator-associated pneumonia and sepsis, and indirectly increase the risk of death [32]. SHR can lead to endothelial dysfunction, promote microthrombosis formation, and accelerate atherosclerosis [33]. Insulin resistance, which is closely related to SHR, will also disrupt the normal myocardial energy metabolism. The ability of the myocardium to effectively utilize glucose to produce energy is impaired, leading to a decrease in cardiac contractility and an increased susceptibility to further damage [34]. In addition, the study by Wang Liao, et al. found that the high SHR state, through activating the renin-angiotensin-aldosterone system (RAAS) and pro-inflammatory factors (such as IL-6 and TNF-α), aggravates the systemic inflammatory response, promotes myocardial fibrosis and an increase in ventricular stiffness, forming a vicious cycle [35]. SHR has a synergistic effect with inflammatory markers. Although this study did not directly detect inflammatory factors such as IL-6 or C-reactive protein (CRP), previous studies have confirmed that SHR is highly correlated with these markers [36,37]. The SOFA score of patients in the Q4 group in this study was significantly increased, indicating multiple organ dysfunction, which is closely related to the systemic inflammatory response mediated by SHR.
The stratified analysis showed that the association between SHR and all-cause mortality had significant heterogeneity in different subgroups. The mortality risk of patients with CHD was significantly increased in all periods (p < 0.05). In the subgroup of patients after coronary artery bypass grafting (CABG), the 30-day and 365-day risks reached HR = 1.838 and 1.850, respectively, and the interaction was significant (p = 0.036 and 0.014). The possible mechanisms include: Patients after CABG develop a systemic inflammatory response due to surgical stress and cardiopulmonary bypass, which exacerbates insulin resistance. In addition, patients with CHD have insufficient coronary artery reserve, and a high SHR further impairs myocardial energy metabolism, leading to a vicious cycle [38,39]. Patients without diabetes have a weaker compensatory ability for acute hyperglycemia and lack the adaptation to chronic hyperglycemia. Therefore, fluctuations in SHR are more likely to trigger an oxidative stress storm [40].
On the contrary, there was no significant association in the subgroups of age (62.75 < Q2 ≤ 74.51 years), BMI (≤ 32.08), male gender, no PCI, hypertension, and no atrial fibrillation (AF) (p > 0.05). Elderly and obese patients may have formed some compensatory mechanisms due to chronic metabolic disorders (such as the secretion of anti-inflammatory factors by adipose tissue), which weakens the short-term impact of SHR [41,42]; patients with hypertension often receive treatment with renin-angiotensin system (RAS) inhibitors, which may partially offset the toxic effects of hyperglycemia by improving endothelial function [43]. It is worth noting that in the 30-day all-cause mortality rate, the mortality risk in the age Q3 subgroup (74.51 < Q3 ≤ 96.3 years) increased significantly (HR = 1.312, p = 0.002), and the risk was higher in women (HR = 1.310, p = 0.005). Young patients have a more intense sympathetic nerve response, and a high SHR may exacerbate myocardial damage through immune activation; in women, fluctuations in estrogen levels affect the stability of glucose metabolism. Especially before menopause, they are more likely to have out-of-control blood glucose under stress.
This study has many advantages. It is the first to confirm that SHR can be used as an independent predictor of the mortality risk in patients with heart failure who received invasive ventilation. Its clinical application may help to identify high-risk patients early and guide individualized blood glucose management. However, this study has the following limitations:
- This study is a retrospective study based on single-center data from the MIMIC-IV database, and it is difficult to exclude unmeasured confounding factors (such as nutritional status and the use of sedative drugs).
- There is a bias in the measurement of blood glucose data in the study. The blood glucose value at admission was not distinguished between fasting and random measurement, which may affect the accuracy of the SHR calculation.
- There is a lack of exploration of the mechanism: The lack of dynamic inflammatory markers (such as IL-6 and CRP) and myocardial metabolic imaging data limits the in-depth interpretation of the causal relationship
- Limitation of the study sample size: Some results in the subgroup analysis may be biased due to insufficient sample size, and a larger-scale prospective study is needed for verification. Future research should combine multi-omics technologies and dynamic blood glucose monitoring to further clarify the molecular mechanism between SHR and the prognosis of heart failure, and explore risk-stratification intervention strategies based on SHR.
In conclusion, SHR is not only an effective tool for evaluating the short-term mortality risk of patients with heart failure but also a useful indicator for identifying high-risk patients in the ICU. Future research should further explore the potential of using SHR in combination with other biomarkers and verify these findings through larger-scale prospective studies to improve the treatment outcomes and survival rates of patients with heart failure.
Authors’ contributions
Pengcheng Zhu and Yuan Hu designed the study. All authors critically revised the manuscript and approved the final version. Yuan Hu supervised the project.
Data availability
The datasets generated during and/or analyzed during the current study are available from the corresponding author on reasonable request.
Declarations
Ethics approval and consent to participate
This study is based on open-source data, so ethical approval is not required.
- Dunlay SM, Roger VL, Killian JM, Weston SA, Schulte PJ, Subramaniam AV, et al. Advanced heart failure epidemiology and outcomes: a population-based study. JACC Heart Fail. 2021;9(10):722-732. Available from: https://www.sciencedirect.com/science/article/pii/S2213177921002253
- Savarese G, Becher PM, Lund LH, Seferovic P, Rosano GMC, Coats AJS. Global burden of heart failure: a comprehensive and updated review of epidemiology. Cardiovasc Res. 2023;118(17):3272-3287. Available from: https://academic.oup.com/cardiovascres/article/118/17/3272/6522620
- Saijo T, Yasumoto K, Ohashi M, Momoki C, Habu D. Association between early enteral nutrition and clinical outcome in patients with severe acute heart failure who require invasive mechanical ventilation. JPEN J Parenter Enteral Nutr. 2022;46(3):443-453. Available from: https://onlinelibrary.wiley.com/doi/10.1002/jpen.2118
- Tavazzi G. Mechanical ventilation in cardiogenic shock. Curr Opin Crit Care. 2021;27(5):447-453. Available from: https://journals.lww.com/co-criticalcare/Abstract/2021/10000/Mechanical_ventilation_in_cardiogenic_shock.10.aspx
- Liu J, Zhou Y, Huang H, Liu R, Kang Y, Zhu T, et al. Impact of stress hyperglycemia ratio on mortality in patients with critical acute myocardial infarction: insight from American MIMIC-IV and the Chinese CIN-II study. Cardiovasc Diabetol. 2023;22:281. Available from: https://cardiab.biomedcentral.com/articles/10.1186/s12933-023-02012-1
- Yan F, Chen X, Quan X, Wang L, Wei X, Zhu J. Association between the stress hyperglycemia ratio and 28-day all-cause mortality in critically ill patients with sepsis: a retrospective cohort study and predictive model establishment based on machine learning. Cardiovasc Diabetol. 2024;23:163. Available from: https://cardiab.biomedcentral.com/articles/10.1186/s12933-024-02265-4
- Zhang Y, Yin X, Liu T, Ji W, Wang G. Association between the stress hyperglycemia ratio and mortality in patients with acute ischemic stroke. Sci Rep. 2024;14:20962. Available from: https://www.nature.com/articles/s41598-024-71778-5
- Esposito K, Marfella R, Giugliano D. Stress hyperglycemia, inflammation, and cardiovascular events. Diabetes Care. 2003;26(5):1650-1651. Available from: https://diabetesjournals.org/care/article/26/5/1650-a/26582
- Li L, Ding L, Zheng L, Wu L, Hu Z, Liu L, et al. Relationship between stress hyperglycemia ratio and acute kidney injury in patients with congestive heart failure. Cardiovasc Diabetol. 2024;23:29. Available from: https://cardiab.biomedcentral.com/articles/10.1186/s12933-023-02105-x
- Li L, Zhao Z, Wang S, Wang J. Stress hyperglycemia ratio and the clinical outcome of patients with heart failure: a meta-analysis. Front Endocrinol (Lausanne). 2024;15:1404028. Available from: https://www.frontiersin.org/articles/10.3389/fendo.2024.1404028
- Huang J, Yin H, Zhang M, Ni Q, Xuan J. Understanding the economic burden of heart failure in China: impact on disease management and resource utilization. J Med Econ. 2017;20:549–553. Available from: https://www.tandfonline.com/doi/full/10.1080/13696998.2017.1297309
- Singh A, Laribi S, Teerlink JR, Mebazaa A. Agents with vasodilator properties in acute heart failure. Eur Heart J. 2017;38:317–325. Available from: https://academic.oup.com/eurheartj/article/38/5/317/1744389
- Alviar CL, Miller PE, McAreavey D, Katz JN, Lee B, Moriyama B, et al. Positive pressure ventilation in the cardiac intensive care unit. J Am Coll Cardiol. 2018;72:1532–1553. Available from: https://www.sciencedirect.com/science/article/pii/S0735109718385029
- Metkus TS, Stephens RS, Schulman S, Hsu S, Morrow DA, Eid SM. Utilization and outcomes of early respiratory support in 6.5 million acute heart failure hospitalizations. Eur Heart J Qual Care Clin Outcomes. 2020;6:72–80. Available from: https://academic.oup.com/ehjqcco/article/6/1/72/5552672
- Miyama H, Shiraishi Y, Kohsaka S, Goda A, Nishihata Y, Nagatomo Y, et al. Abnormal liver function tests and long-term outcomes in patients discharged after acute heart failure. J Clin Med. 2021;10:1730. Available from: https://www.mdpi.com/2077-0383/10/8/1730
- Schefold JC, Filippatos G, Hasenfuss G, Anker SD, von Haehling S. Heart failure and kidney dysfunction: epidemiology, mechanisms and management. Nat Rev Nephrol. 2016;12:610–623. Available from: https://www.nature.com/articles/nrneph.2016.113
- Lapinsky SE. Endotracheal intubation in the ICU. Crit Care. 2015;19:258. Available from: https://ccforum.biomedcentral.com/articles/10.1186/s13054-015-0964-z
- Russotto V, Myatra SN, Laffey JG, Tassistro E, Antolini L, Bauer P, et al. Intubation practices and adverse peri-intubation events in critically ill patients from 29 countries. JAMA. 2021;325:1164–1172. Available from: https://jamanetwork.com/journals/jama/fullarticle/2777394
- Zhang S, Guo M, Wu F, Xiong N, Ma Y, Wang Z, et al. Factors associated with asymptomatic infection in health-care workers with severe acute respiratory syndrome coronavirus 2 infection in Wuhan, China: a multicentre retrospective cohort study. Clin Microbiol Infect. 2020;26:1670–1675. Available from: https://www.clinicalmicrobiologyandinfection.com/article/S1198-743X(20)30536-4/fulltext
- Li L, Zhao Z, Wang S, Wang J. Stress hyperglycemia ratio and the clinical outcome of patients with heart failure: a meta-analysis. Front Endocrinol (Lausanne). 2024;15:1404028. Available from: https://www.frontiersin.org/articles/10.3389/fendo.2024.1404028
- Yan F, Chen X, Quan X, Wang L, Wei X, Zhu J. Association between the stress hyperglycemia ratio and 28-day all-cause mortality in critically ill patients with sepsis: a retrospective cohort study and predictive model establishment based on machine learning. Cardiovasc Diabetol. 2024;23:163. Available from: https://cardiab.biomedcentral.com/articles/10.1186/s12933-024-02265-4
- Zhang C, Shen HC, Liang WR, Ning M, Wang ZX, Chen Y, et al. Relationship between stress hyperglycemia ratio and all-cause mortality in critically ill patients: results from the MIMIC-IV database. Front Endocrinol (Lausanne). 2023;14:1111026. Available from: https://www.frontiersin.org/articles/10.3389/fendo.2023.1111026
- Tian J, Zhou T, Liu Z, Dong Y, Xu H. Stress hyperglycemia is associated with poor prognosis in critically ill patients with cardiogenic shock. Front Endocrinol (Lausanne). 2024;15:1446714. Available from: https://www.frontiersin.org/articles/10.3389/fendo.2024.1446714
- Matias AA, Manique I, Sabino T, Rego T, Mihon C, Panarra A, et al. Absolute hyperglycemia versus stress hyperglycemia ratio for the prognosis of hospitalized patients with COVID-19 in the first months of the pandemic: a retrospective study. Diabetes Ther. 2023;14:335–346. Available from: https://link.springer.com/article/10.1007/s13300-022-01347-4
- Su YW, Hsu CY, Guo YW, Chen HS. Usefulness of the plasma glucose concentration-to-HbA1c ratio in predicting clinical outcomes during acute illness with extreme hyperglycaemia. Diabetes Metab. 2017;43:40–47. Available from: https://www.sciencedirect.com/science/article/abs/pii/S1262363616302152
- Barbu E, Mihaila A, Filippi A, Stoenescu A, Ciortan L, Butoi E, et al. Stress, hyperglycemia, and insulin resistance correlate with neutrophil activity and impact acute myocardial infarction outcomes. Cureus. 2024;16:e63731. Available from: https://www.cureus.com/articles/261137-stress-hyperglycemia-and-insulin-resistance-corroborate-with-neutrophil-activity-and-impact-acute-myocardial-infarction-outcomes
- Skyler JS, Bergenstal R, Bonow RO, Buse J, Deedwania P, Gale EA, et al. Intensive glycemic control and the prevention of cardiovascular events: implications of the ACCORD, ADVANCE, and VA diabetes trials: a position statement of the American Diabetes Association and a scientific statement of the American College of Cardiology Foundation and the American Heart Association. J Am Coll Cardiol. 2009;53:298–304. Available from: https://www.jacc.org/doi/full/10.1161/circulationaha.108.191305
- Denorme F, Portier I, Kosaka Y, Campbell RA. Hyperglycemia exacerbates ischemic stroke outcome independent of platelet glucose uptake. J Thromb Haemost. 2021;19:536–546. Available from: https://onlinelibrary.wiley.com/doi/10.1111/jth.15154
- Pandolfi A, Giaccari A, Cilli C, Alberta MM, Morviducci L, De Filippis EA, et al. Acute hyperglycemia and acute hyperinsulinemia decrease plasma fibrinolytic activity and increase plasminogen activator inhibitor type 1 in the rat. Acta Diabetol. 2001;38:71–76. Available from: https://link.springer.com/article/10.1007/s005920170016
- Sonsoz MR, Karadamar N, Yilmaz HC, Eroglu Z, Sahin KK, Ozates Y, et al. C-reactive protein to albumin ratio predicts in-hospital mortality in patients with acute heart failure. Turk Kardiyol Dern Ars. 2023;51:174–181. Available from: https://tkddergisi.org/abstract.php?id=3981
- Lin Z, Liang X, Zhang Y, Dai Y, Zeng L, Chen W, et al. Positive association between stress hyperglycemia ratio and pulmonary infection in patients with ST-segment elevation myocardial infarction undergoing percutaneous coronary intervention. Cardiovasc Diabetol. 2023;22:76. Available from: https://cardiab.biomedcentral.com/articles/10.1186/s12933-023-01799-3
- Krebs ED, Chancellor WZ, Beller JP, Mehaffey JH, Hawkins RB, Sawyer RG, et al. Long-term implications of tracheostomy in cardiac surgery patients: decannulation and mortality. Ann Thorac Surg. 2021;111:594–599. Available from: https://www.annalsthoracicsurgery.org/article/S0003-4975(20)31161-4/fulltext
- Ormazabal V, Nair S, Elfeky O, Aguayo C, Salomon C, Zuniga FA. Association between insulin resistance and the development of cardiovascular disease. Cardiovasc Diabetol. 2018;17:122. Available from: https://cardiab.biomedcentral.com/articles/10.1186/s12933-018-0762-4
- Ding L, Zhang H, Dai C, Zhang A, Yu F, Mi L, et al. The prognostic value of the stress hyperglycemia ratio for all-cause and cardiovascular mortality in patients with diabetes or prediabetes: insights from NHANES 2005–2018. Cardiovasc Diabetol. 2024;23:84. Available from: https://cardiab.biomedcentral.com/articles/10.1186/s12933-024-02172-8
- Liao W, Chen Y, Gao Q, Gan R, Li M, Liu Z, et al. Impact of stress hyperglycemia ratio, derived from glycated albumin or hemoglobin A1c, on mortality among ST-segment elevation myocardial infarction patients. Cardiovasc Diabetol. 2023;22:334. Available from: https://cardiab.biomedcentral.com/articles/10.1186/s12933-023-02061-6
- Barbu E, Mihaila A, Filippi A, Stoenescu A, Ciortan L, Butoi E, et al. Stress, hyperglycemia, and insulin resistance correlate with neutrophil activity and impact acute myocardial infarction outcomes. Cureus. 2024;16:e63731. Available from: https://www.cureus.com/articles/261137-stress-hyperglycemia-and-insulin-resistance-corroborate-with-neutrophil-activity-and-impact-acute-myocardial-infarction-outcomes
- Motoyama S. C-reactive protein -717C>T genetic polymorphism associates with esophagectomy-induced stress hyperglycemia. World J Surg. 2010;34:1001–1007.
- Olesen OJ, Vinding NE, Østergaard L, Butt JH, Gislason GH, Torp-Pedersen C, et al. C-reactive protein after coronary artery bypass graft surgery and its relationship with postoperative atrial fibrillation. Europace. 2020;22:1182–1188. Available from: https://academic.oup.com/europace/article/22/8/1182/5893503
- Wu Z, Cheng C, Sun X, Wang J, Guo D, Chen S, et al. The synergistic effect of the triglyceride-glucose index and serum uric acid on the prediction of major adverse cardiovascular events after coronary artery bypass grafting: a multicenter retrospective cohort study. Cardiovasc Diabetol. 2023;22:103. Available from: https://cardiab.biomedcentral.com/articles/10.1186/s12933-023-01838-z
- Kerby JD, Griffin RL, MacLennan P, Rue LW. Stress-induced hyperglycemia, not diabetic hyperglycemia, is associated with higher mortality in trauma. Ann Surg. 2012;256:446–452.
- Ren Y, Zhao H, Yin C, Lan X, Wu L, Du X, et al. Adipokines, hepatokines, and myokines: focus on their role and molecular mechanisms in adipose tissue inflammation. Front Endocrinol (Lausanne). 2022;13:873699. Available from: https://www.frontiersin.org/articles/10.3389/fendo.2022.873699
- Yan F, Chen X, Quan X, Wang L, Wei X, Zhu J. Association between the stress hyperglycemia ratio and 28-day all-cause mortality in critically ill patients with sepsis: a retrospective cohort study and predictive model establishment based on machine learning. Cardiovasc Diabetol. 2024;23:163. Available from: https://cardiab.biomedcentral.com/articles/10.1186/s12933-024-02265-4
- Fujimura N, Noma K, Hata T, Soga J, Hidaka T, Idei N, et al. Mineralocorticoid receptor blocker eplerenone improves endothelial function and inhibits rho-associated kinase activity in patients with hypertension. Clin Pharmacol Ther. 2012;91:289–297. Available from: https://www.nature.com/articles/clpt2011227