
More Information
Submitted: November 07, 2025 | Approved: November 11, 2025 | Published: November 12, 2025
How to cite this article: Chiang CM. CXR‑Hemo: A Calibrated Logistic Model and Deployable API for Threshold‑linked Hemodynamic Risk. J Cardiol Cardiovasc Med. 2025; 10(6): 137-140. Available from:
https://dx.doi.org/10.29328/journal.jccm.1001221
DOI: 10.29328/journal.jccm.1001221
Copyright license: © 2025 Chiang CM. This is an open access article distributed under the Creative Commons Attribution License, which permits unrestricted use, distribution, and reproduction in any medium, provided the original work is properly cited.
Keywords: Chest radiography; Vascular pedicle width; ; Lung transparency; Calibration; Decision curve analysis; ABG/VBG; Mean arterial pressure; FastAPI

CXR‑Hemo: A Calibrated Logistic Model and Deployable API for Threshold‑linked Hemodynamic Risk
Chi-Ming Chiang1,2*
1Center for General Education, Chung Yuan Christian University, No. 200, Zhongbei Rd., Zhongli District, 320 Taoyuan, Taiwan, Republic of China
2Department of Orthopedics, National Yang Ming Chiao Tung University Hospital, No. 169, Xiaoshe Rd., 260 Yilan, Taiwan, Republic of China
*Address for Correspondence: Chi-Ming Chiang, MD, PhD, Center for General Education, Chung Yuan Christian University, No. 200, Zhongbei Rd., Zhongli District, 320 Taoyuan, Taiwan, Republic of China, Email: [email protected]
Background: Routine chest radiography (CXR) is inexpensive and ubiquitous. Beyond categorical reads, classical CXR metrics—CTR, VPW, and a lung transparency index (LTI)—encode hemodynamic and pulmonary information. We present CXR‑Hemo, a math‑first framework and deployable API that converts these metrics together with bedside physiology (SpO2, ABG/VBG, MAP) into calibrated probabilities linked to clinical decision thresholds via decision‑curve analysis (DCA).
Methods: We formalize a constrained logistic risk function with monotonic feature effects and a reader‑in‑the‑loop design. Image metrics are computed automatically from standardized definitions: CTR from transverse diameters; VPW from mediastinal landmarks with projection‑aware scaling (millimeters via DICOM PixelSpacing); and LTI from normalized lung‑mask intensity. Physiologic inputs include SpO2, ABG/VBG surrogates, lactate, and MAP. Post‑hoc probability calibration uses isotonic regression or temperature scaling with reliability curves and Brier score auditing. Clinical utility is summarized across 0.2–0.6 thresholds using DCA. We expose three JSON endpoints—/cxr/metrics, /physio/ingest, and /risk/hemo—to return calibrated risk, attention weights, and net‑benefit snapshots.
Findings (analytical demonstration): We provide calibration diagnostics and DCA curves using simulated data to illustrate threshold‑linked interpretation, accompanied by a schematic depicting dual encoders, a modality gate α, a constrained logistic head, and post‑hoc calibration to produce an actionable probability.
Interpretation: By explicitly foregrounding calibration and DCA, CXR‑Hemo links probabilities to threshold‑anchored actions and can avert discretionary CT in risk ranges where model‑guided net benefit exceeds ‘CT‑for‑all’ [1,2]. Given the large dose differential between CXR and chest CT in adults (≈0.1 mSv vs. several mSv), the framework has the potential to reduce population radiation exposure while maintaining clinical safety [3,4].
CXR‑Hemo reframes routine CXR and basic gases as a probabilistic, interpretable sensor for hemodynamic risk. By foregrounding calibration and DCA, the approach links probabilities to actions, enabling a transparent, threshold‑aware tool suitable for resource‑variable emergency care.
Clinical decisions are threshold‑based, yet most radiographs are interpreted categorically. A math‑first reframing uses CXR as a probabilistic sensor when classical image‑derived metrics (CTR/VPW/LTI) are combined with bedside physiology (SpO₂, ABG/VBG, MAP) and calibrated to yield actionable probabilities. Decision‑curve analysis (DCA) then links those probabilities to threshold‑dependent net benefit, offering a principled alternative to ‘CT‑for‑all’ or ‘CT‑for‑none’ [1,2]. This article formalizes CXR‑Hemo, a constrained logistic model and deployable API that emphasizes interpretability, calibration, and clinical utility, following contemporary guidance on calibration for clinical prediction models [5].
This work advances a math‑first, reader‑in‑the‑loop approach in which routine CXR metrics (CTR/VPW/LTI) and bedside physiology are fused under a constrained logistic model with post‑hoc calibration and threshold‑linked interpretation via decision‑curve analysis [1,2,5]. The innovation is threefold: (i) monotone, clinically aligned parameters that render risk contributions inspectable; (ii) a modality gate α that adaptively re‑weights image and physiology channels based on quality and availability; and (iii) a deployable API blueprint that surfaces calibrated probability, feature attributions, and net‑benefit snapshots. Framed as a triage instrument, CXR‑Hemo seeks to decrease avoidable chest CTs—hence radiation exposure—without sacrificing utility, leveraging the substantial dose gap between CXR and CT [3,4].
CXR metrics
CTR is computed from thoracic and cardiac transverse diameters on PA/AP projection with technique‑aware normalization; automation follows lung‑ and heart‑mask segmentation with quality checks for rotation and field‑of‑view truncation [6,7]. VPW is measured between reproducible mediastinal landmarks and reported in millimeters using DICOM PixelSpacing, VPW(mm)=|x_r−x_l|×PixelSpacing; serial ΔVPW contextualizes fluid balance [8,9]. LTI derives from normalized mean intensity within lung masks with histogram clipping for tubes and lines; 1−LTI serves as an opacity proxy. Each metric is accompanied by QA flags (projection mismatch, clipping, motion) that enter the gating vector for α.
Cardiothoracic ratio (CTR) is cardiac transverse diameter divided by thoracic transverse diameter, measured on PA/AP projection with technique‑aware normalization; modern automation improves reproducibility [6,7].
Vascular pedicle width (VPW) is the width of the mediastinal vascular pedicle between reproducible landmarks; values are reported in millimeters via DICOM PixelSpacing. Serial ΔVPW contextualizes fluid balance and intravascular volume status [8,9]. As shown in Figure 1, the anatomical landmarks allow reproducible measurement across serial CXRs.
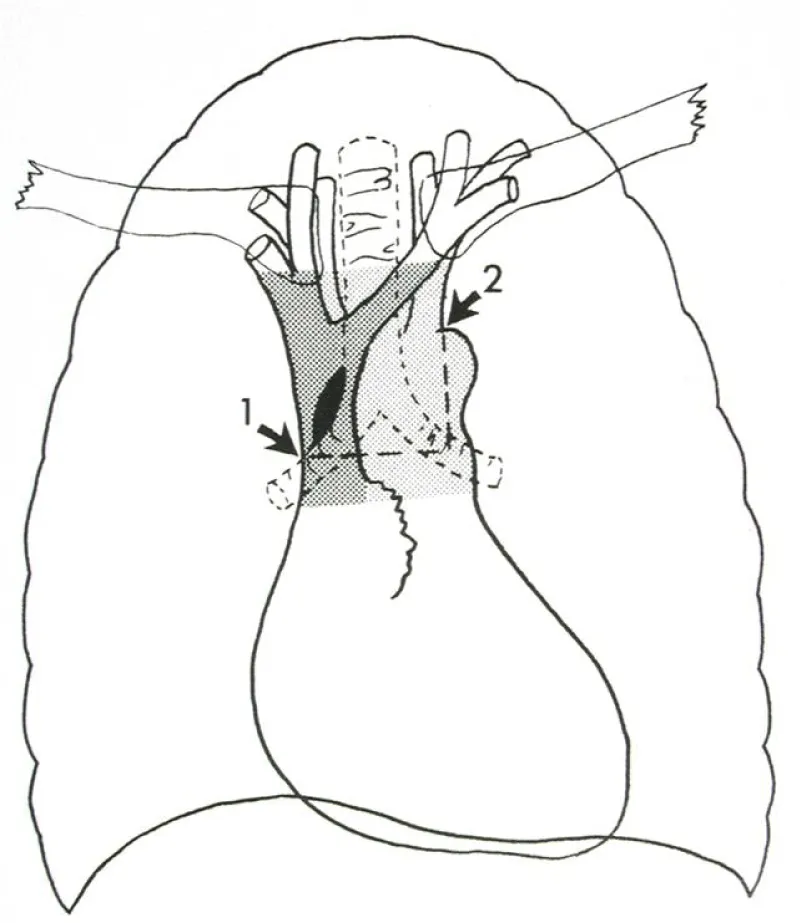
Figure 1: Measurement of Vascular Pedicle Width (VPW). Schematic illustration of the mediastinal vascular pedicle with reproducible landmarks; VPW is measured horizontally between landmarks and serves as a radiographic correlate of intravascular volume.
The lung transparency index (LTI) summarizes normalized per‑pixel intensity within lung masks (0–1); lower values indicate edema‑like opacity and redistribution. In Figure 2, we illustrate how VPW and lung transparency co‑vary with fluid balance and volume overload.
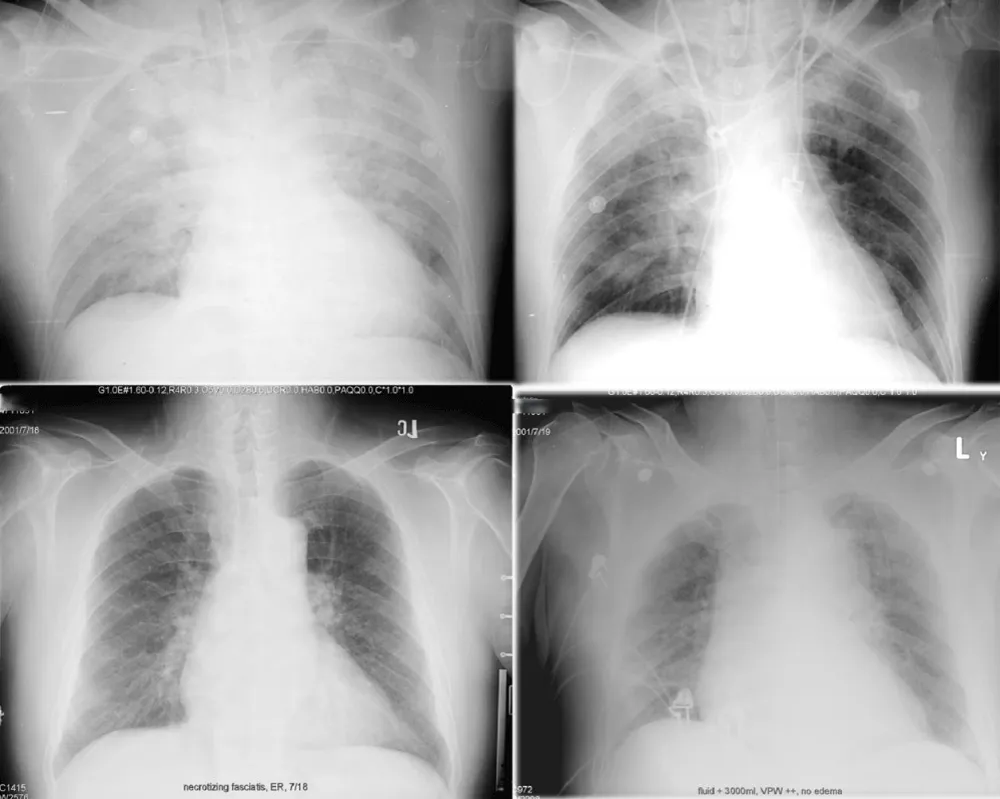
Figure 2: Radiographic examples of fluid balance and overload. Top row (same patient): left, input/output +1000 mL; right, I/O −1000 mL. Bottom row (different patient, necrotizing fasciitis with fluid overload): widened VPW and reduced lung transparency consistent with congestion.
Physiologic inputs
We ingest SpO₂ and SvO₂ surrogates when available, ABG/VBG measurements (PaO₂, PaCO₂/PvCO₂, pH, lactate), and MAP. Robust z‑scores (median/IQR) and log1p transforms are used to stabilize scale and heavy tails. In ED settings, VBG can be an acceptable surrogate for ventilation/acid‑base decisions with caution, consistent with contemporary evidence [10-12].
Mathematical formulation
Let x_img = [max(0,CTR−0.50), ΔVPW/5, 1−LTI] and x_phys = [(95−SpO₂)/5, (80−PaO₂)/10, (65−MAP)/10, log(1+lactate)]. Coefficients are constrained to be non‑negative to preserve clinical monotonicity. The modality gate α∈[0,1] adaptively weighs image vs physiology channels based on projection, image‑quality heuristics, and missingness (α=σ(γ₀+γᵀs)). Risk is p = σ(β₀+α·β_imgᵀx_img+(1−α)·β_physᵀx_phys). Calibration uses temperature scaling or isotonic regression on a held‑out fold, with reliability curves, Brier loss, and calibration slope/intercept reported [5].
Let the imaging vector be x_img = [ max(0, CTR − 0.50), ΔVPW/5, 1 − LTI ] and the physiology vector be x_phys = [ (95 − SpO₂)/5, (80 − PaO₂)/10, (65 − MAP)/10, log(1 + lactate) ]. Coefficients are constrained to be non‑negative, so risk increases monotonically with cardiomegaly, vascular congestion, opacity, hypoxemia, and hypotension. The fused representation is z = β_img^T x_img + β_phys^T x_phys, and risk is p = σ(β₀ + z), where σ(·) denotes the logistic function.
Calibration and uncertainty
Post‑hoc probability calibration uses temperature scaling (single‑parameter logit rescaling) or isotonic regression on a held‑out fold. Stability is summarized by Brier loss, calibration slope/intercept, and reliability curves, with bootstrap variability of p reported as uncertainty.
Clinical utility analysis
Net benefit is evaluated with DCA across thresholds 0.2–0.6, comparing model‑guided actions versus CT‑for‑all and CT‑for‑none [1,2]. The canonical formula is NB(p_t) = (TP/N) − (FP/N) × p_t/(1 − p_t), which translates threshold‑calibrated probabilities into expected clinical value.
Implementation and API
Phase A (internal‑external validation): multi‑site temporal validation with site‑wise calibration audit (Brier score, slope/intercept, reliability plots) and DCA across p_t∈[0.2,0.6] [1,2,5]. Primary endpoint is hemodynamic deterioration within 24 h (vasopressor initiation or lactate ≥4 mmol/L); secondary endpoints include CT utilization and time‑to‑CT. We will stratify by projection (PA/AP), body habitus, and oxygen‑delivery modality, and quantify α behaviour across strata. Phase B (prospective pilot): reader‑in‑the‑loop ED deployment with calibrated probabilities surfaced beside standard reads; operational metrics include alert burden, false‑positive CTs avoided, and calibration‑drift monitoring.
External and prospective validation plan
We expose a deployable API blueprint with three endpoints; probabilities are post‑hoc calibrated and accompanied by a reliability context. The interface foregrounds explainability and threshold‑linked recommendations derived from DCA. A schematic overview is provided in Figure 3.
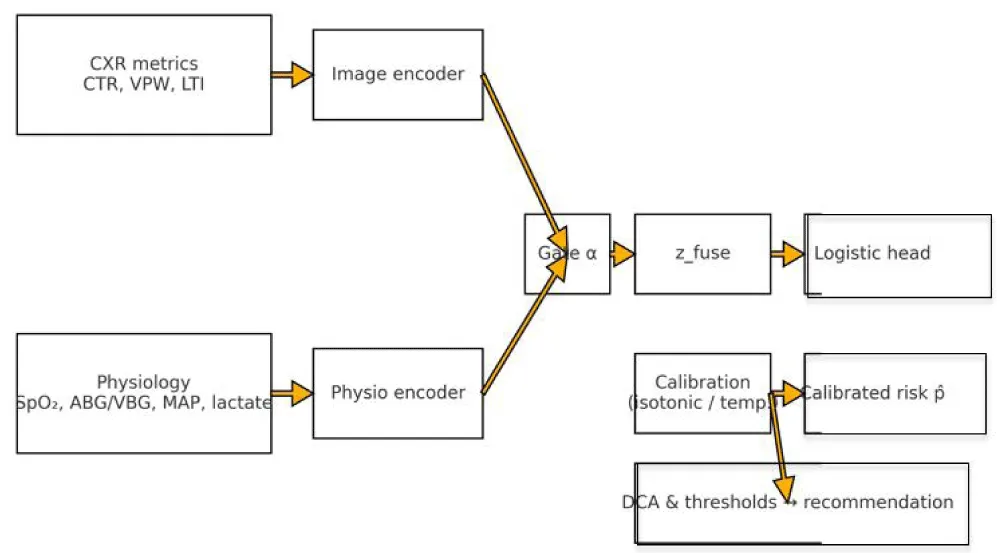
Figure 3: System and math overview (API schematic). Dual branch encoders aggregate CTR/VPW/LTI and physiology. A modality gate α forms a fused representation passed to a constrained logistic head; post hoc calibration yields a calibrated probability p̂; DCA maps p̂ to threshold linked recommendations.
POST /risk/hemo -> {“risk”: 0.41, “attention”: {“img”:0.62, “phys”:0.38}, “recommended_threshold”: 0.30, “suggestion”: “Observe for ~2 hours then re‑assess CT (net benefit +0.032)”}
Analytical demonstration (simulated)
To emphasize interpretability over discrimination, we illustrate calibration behaviour and decision‑curve net benefit on simulated data. Calibration and DCA summaries are shown in Figures 4,5 (Tables 1-3).
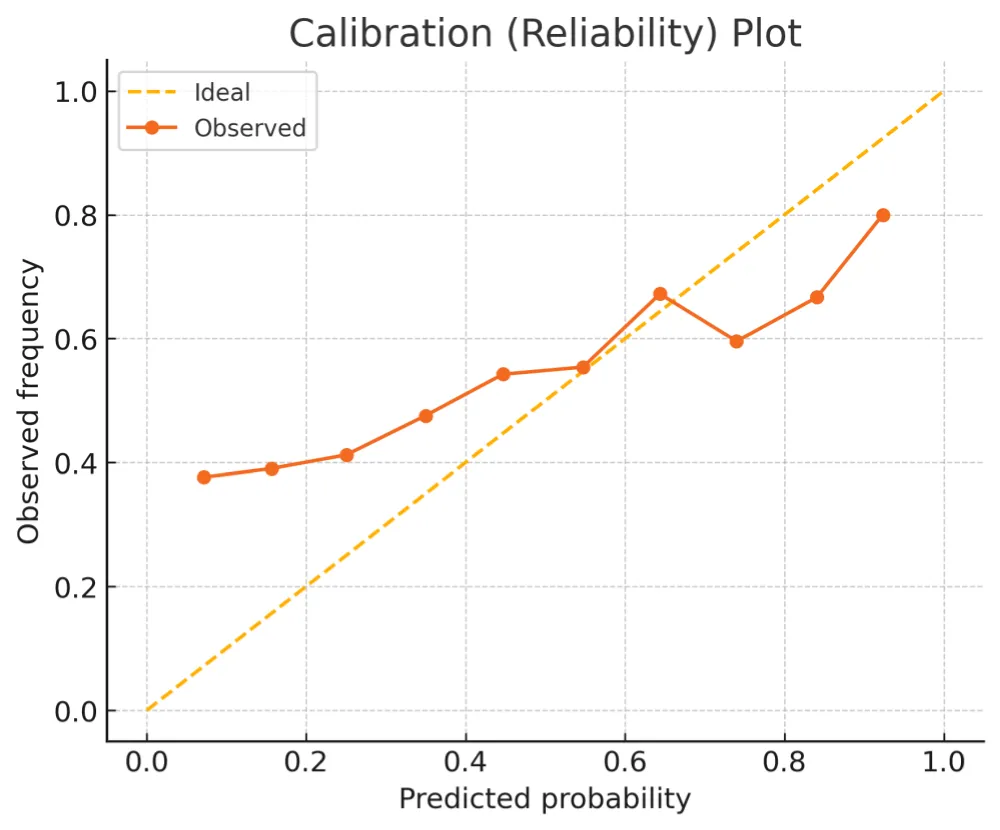
Figure 4: Calibration (reliability) plot. Binned observed outcome frequencies versus predicted probabilities (dots) compared with the ideal diagonal (dashed).
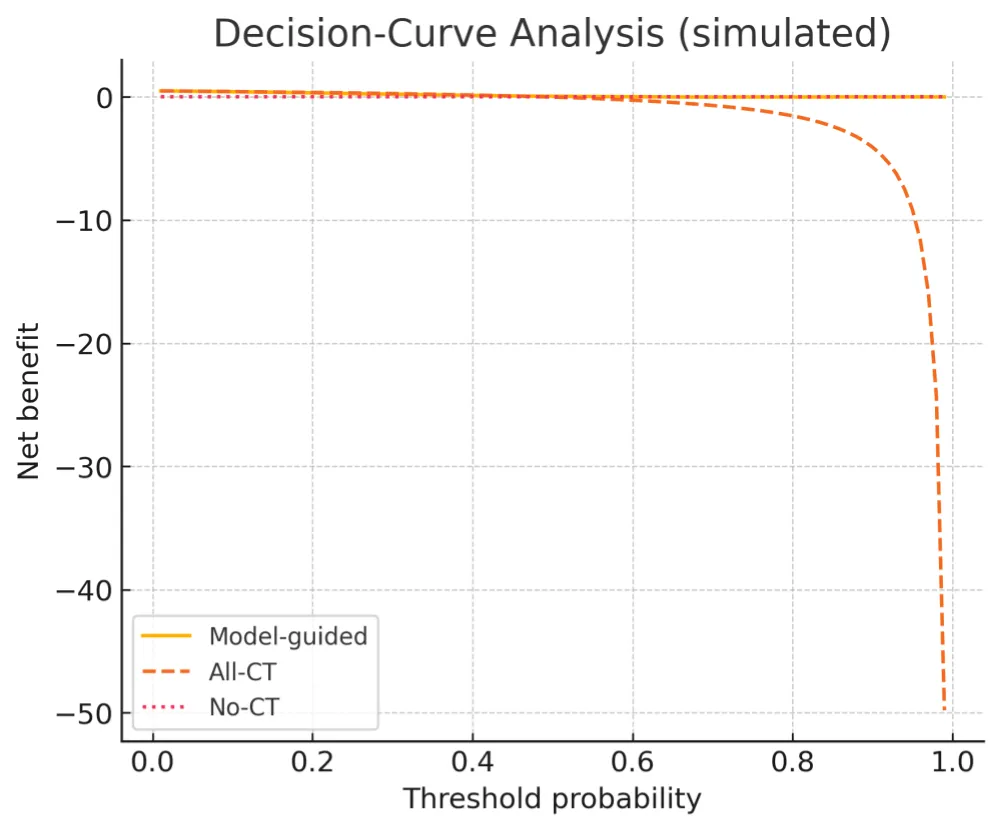
Figure 5: Decision Curve Analysis (simulated). Net benefit for a model guided strategy compared with “All CT” and “No CT” across thresholds 0.01–0.99. ED relevance: the grey band (0.2–0.6) marks the threshold range of clinical equipoise in the ED; under Taiwan National Health Insurance (NHI), CT becomes net beneficial at approximately p_t ≈ 0.28 (net benefit > 0), motivating the recommended operating region.
| Table 1 | ||
| Metric | Operational definition | Notes |
| CTR | Cardiac width / Thoracic width (PA/AP); automated when possible. | Technique‑aware normalization. |
| VPW | The width between reproducible mediastinal vascular landmarks. | Report in mm via DICOM PixelSpacing; ΔVPW for serial context. |
| LTI | Normalized mean intensity within lung masks (0–1). | Report 1‑LTI as opacity proxy. |
| Table 2 | ||
| Endpoint | Input | Output |
| /cxr/metrics | DICOM/PNG; projection tag | ctr, vpw_mm, lti |
| /physio/ingest | spo2, map, abg, vbg, lactate | validated physiologic payload |
| /risk/hemo | image + physiology payloads | calibrated risk, attention weights, DCA snapshot |
| Table 3: ΔVPW quantification example and PixelSpacing formula. | ||||
| Study | Baseline VPW (mm) | Current VPW (mm) | ΔVPW (mm) | ΔVPW/5 (unit) |
| Example 1 | 60 | 65 | 5 | 1.0 |
| Example 2 | 58 | 68 | 10 | 2.0 |
| Engineering note: VPW (mm) = |x_r − x_l| × PixelSpacing; ΔVPW = VPW_t − VPW_baseline; the model uses ΔVPW/5 for scaling. | ||||
Calibrated probabilities—not arbitrary scores—are the proper currency of clinical decisions. DCA links those probabilities to a threshold‑dependent value, enabling explicit trade‑offs among radiation, throughput, and safety [1,2]. VPW tracks intravascular volume and fluid balance, CTR scales as a surrogate for cardiomegaly, and reduced LTI reflects opacity consistent with edema; together with MAP and opportunistic VBG sampling, these features yield a universally available basis for risk [6-13].
Limitations
Our current figures are simulated and primarily illustrate calibration and threshold‑linked interpretation rather than report site‑specific performance; external and prospective validation (Methods 2.7) is underway. Metric robustness may be reduced in AP or supine radiographs, in severe rotation/motion, with indwelling hardware, or in extremes of body habitus despite projection‑aware scaling. PixelSpacing heterogeneity and chronic parenchymal disease can bias LTI; protocolized QA and reader‑in‑the‑loop adjudication partially mitigate these effects. Age‑extreme populations require additional verification. ABG–VBG interchangeability is contextual, and protocols should specify when arterial sampling is mandatory [10-13].
A calibrated, math‑first fusion of routine CXR metrics and bedside physiology can transform a low‑cost test into an actionable, interpretable hemodynamic risk instrument. By foregrounding calibration and decision‑curve analysis and providing a deployable API, CXR‑Hemo links probabilities to actions and is well‑suited for reader‑in‑the‑loop deployment.
Declarations
Ethics approval and consent to participate: Not applicable (methods paper without identifiable patient data).
Availability of data and materials: Prototype API code and synthetic examples will be provided as supplementary material upon request.
Author contributions: C‑M.C. conceived the study, designed the mathematical framework, constructed the API blueprint, created the figures, and wrote the manuscript.
- Vickers AJ, Elkin EB. Decision curve analysis: a novel method for evaluating prediction models. Med Decis Making. 2006;26(6):565–574. Available from: https://doi.org/10.1177/0272989x06295361
- Vickers AJ, Van Calster B, Steyerberg EW. A simple, step-by-step guide to interpreting decision curve analysis. Diagn Progn Res. 2019;3:18. Available from: https://doi.org/10.1186/s41512-019-0064-7
- RadiologyInfo.org (ACR/RSNA). Radiation dose from X-ray and CT exams. Reviewed April 15, 2025. Typical adult chest X-ray ≈0.1 mSv. Available from: https://www.radiologyinfo.org/en/info/safety-xray
- Larke FJ, Kruger RL, Cagnon CH, Flynn MJ, McNitt-Gray MM, Wu X, et al. Estimated radiation dose associated with low-dose chest CT protocols. AJR Am J Roentgenol. 2011;197(1):W8–W17. Available from: https://doi.org/10.2214/ajr.11.6533
- Huang Y, Li W, Macheret F, Gabriel RA. A tutorial on calibration measurements and calibration models for clinical prediction models. Stat Med. 2020;39(30):4051–4074. Available from: https://doi.org/10.1093/jamia/ocz228
- Yang Y, Zheng J, Guo P, Wu T, Gao Q, Guo Y, et al. Automatic cardiothoracic ratio calculation based on lung fields in PA CXR. Front Physiol. 2024;14:1416192. Available from: https://doi.org/10.3389/fphys.2024.1416912
- Kufel J, Paszkiewicz I, Kocot S, Lis A, Dudek P, Czogalik Ł, et al. Deep learning in cardiothoracic ratio calculation and its clinical utility. Diagnostics. 2024;14(7):e000000. Available from: https://doi.org/10.3390/jcm13144180
- Ely EW. Using the chest radiograph to determine intravascular volume status: the role of vascular pedicle width. Chest. 2002;121:942–950. Available from: https://doi.org/10.1378/chest.121.3.942
- Wang H, Shi R, Mahler S, Gaspard J, Gorchynski J, D'Etienne J, et al. Vascular pedicle width on chest radiograph as a measure of circulating blood volume. J Intensive Care Med. 2011;26:343–349. Available from: https://doi.org/10.5811/westjem.2011.3.2023
- Saberian L, Sharif M, Aarabi M, Broumand B, Shafiee MA. Arterial versus venous blood gas analysis: comparisons, appropriateness, and alternatives in adult-based clinical settings. Cureus. 2023;15(7):e41707. Available from: https://doi.org/10.7759/cureus.41707
- Prasad H, Vempalli N, Agrawal N, Ajun UN, Salam A, Datta SS, et al. Correlation and agreement between arterial and venous blood gas in hypotensive ED patients. Int J Emerg Med. 2023;16:65. Available from: https://doi.org/10.1186/s12245-023-00486-0
- Weimar Z, Smallwood N, Shao J, Chen XE, Moran TP, Khor YH, et al. Arterial blood gas analysis or venous blood gas analysis in the ED? Intern Med J. 2024;54(8):1420–1428. Available from: https://doi.org/10.1111/imj.16438
- Evans L, Rhodes A, Alhazzani W, Antonelli M, Coopersmith CM, French C, et al. Surviving Sepsis Campaign: 2021 international guidelines for management of sepsis and septic shock. Intensive Care Med. 2021;47(11):1181–1247. Available from: https://doi.org/10.1007/s00134-021-06506-y